December 05, 2015
The first wave of low pressure that rolled onshore Thursday did produce some high wind. Frame below shows 36 hours of observations from a high wind location along with full disk satellite image of system pushing on shore.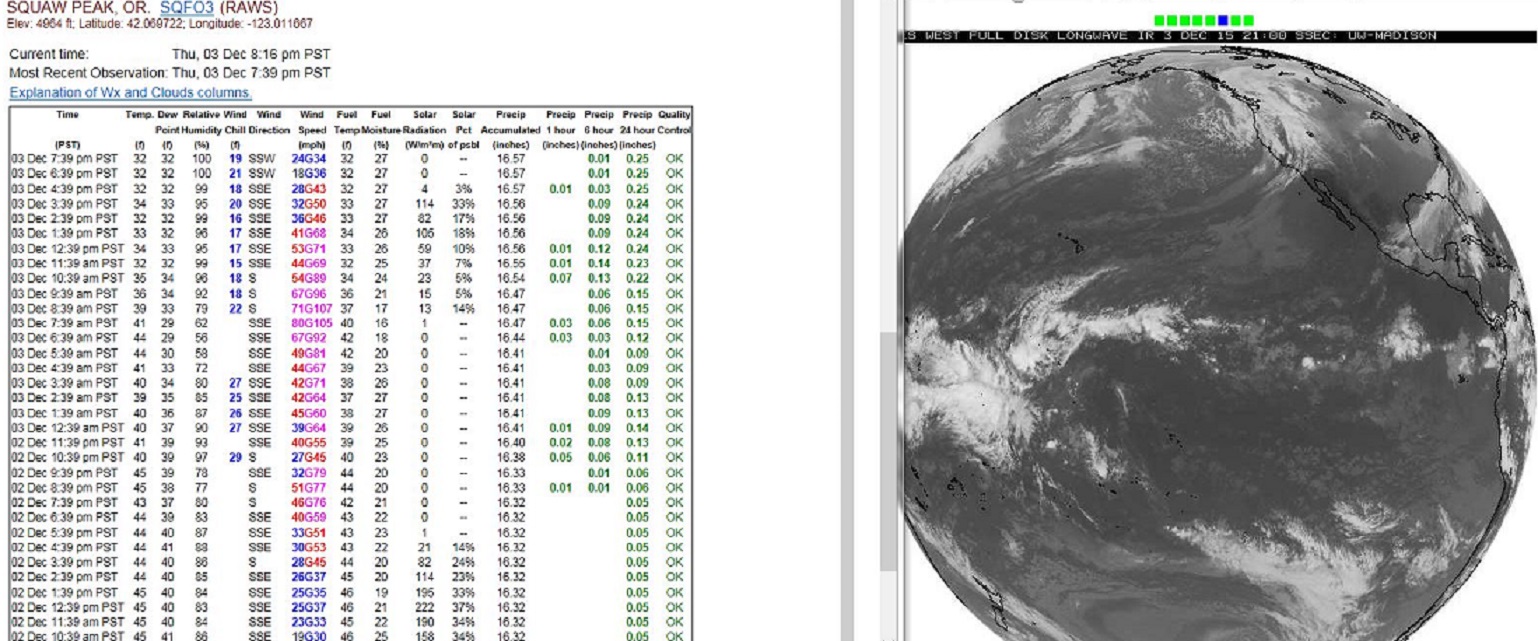
A closer view of highest winds observed at this location shows gust over 100mph at the height of the storm.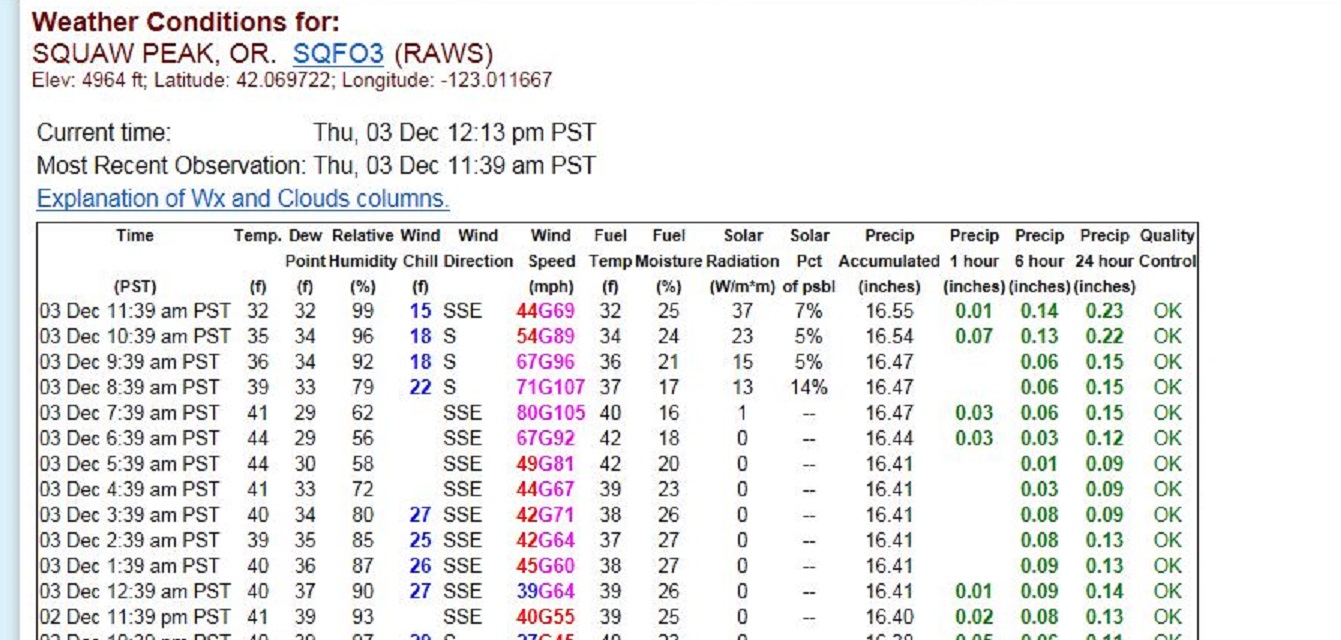
Below an attempt to show location of Squaw Peak along the California Oregon border and further illustrate it is a real observation point accessible through NWS websites. The observation below does have a time of 3:39EST. To match the wind speed and gusts to the observations above, look at the 12:39PST observation.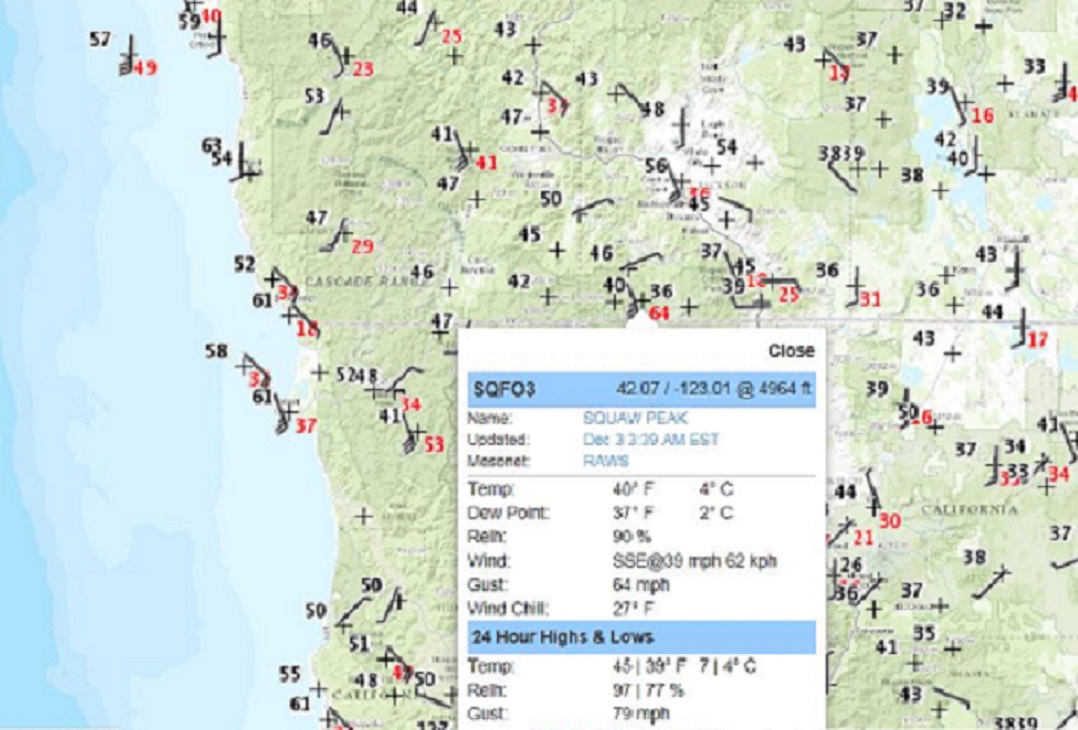
And yes it snowed, at least for some, this is from Crater Lake National Park, elevation over 6000 feet. Located just off the northeast corner of the map above.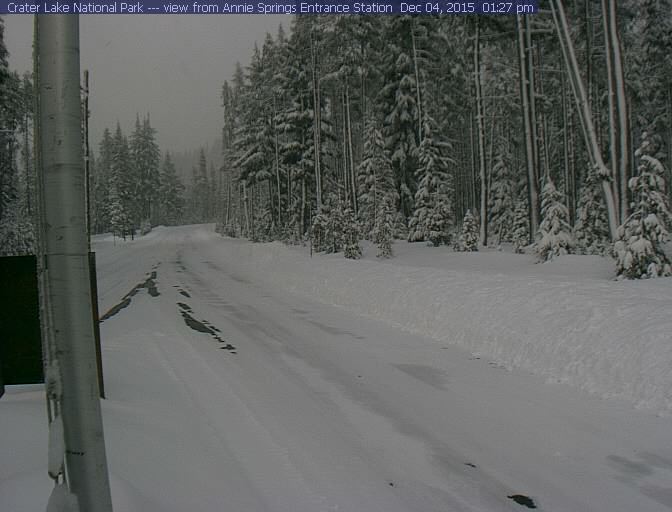
Mount Lassen and Manzanita Lake experience of brief clearing late on Friday after the storm brought snowfall to the area on Thursday and Thursday night.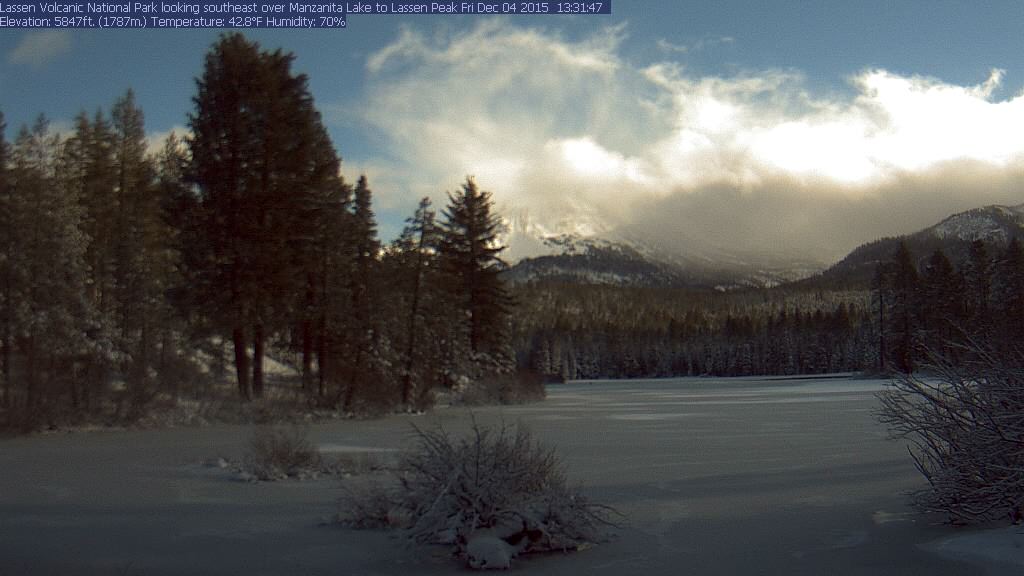
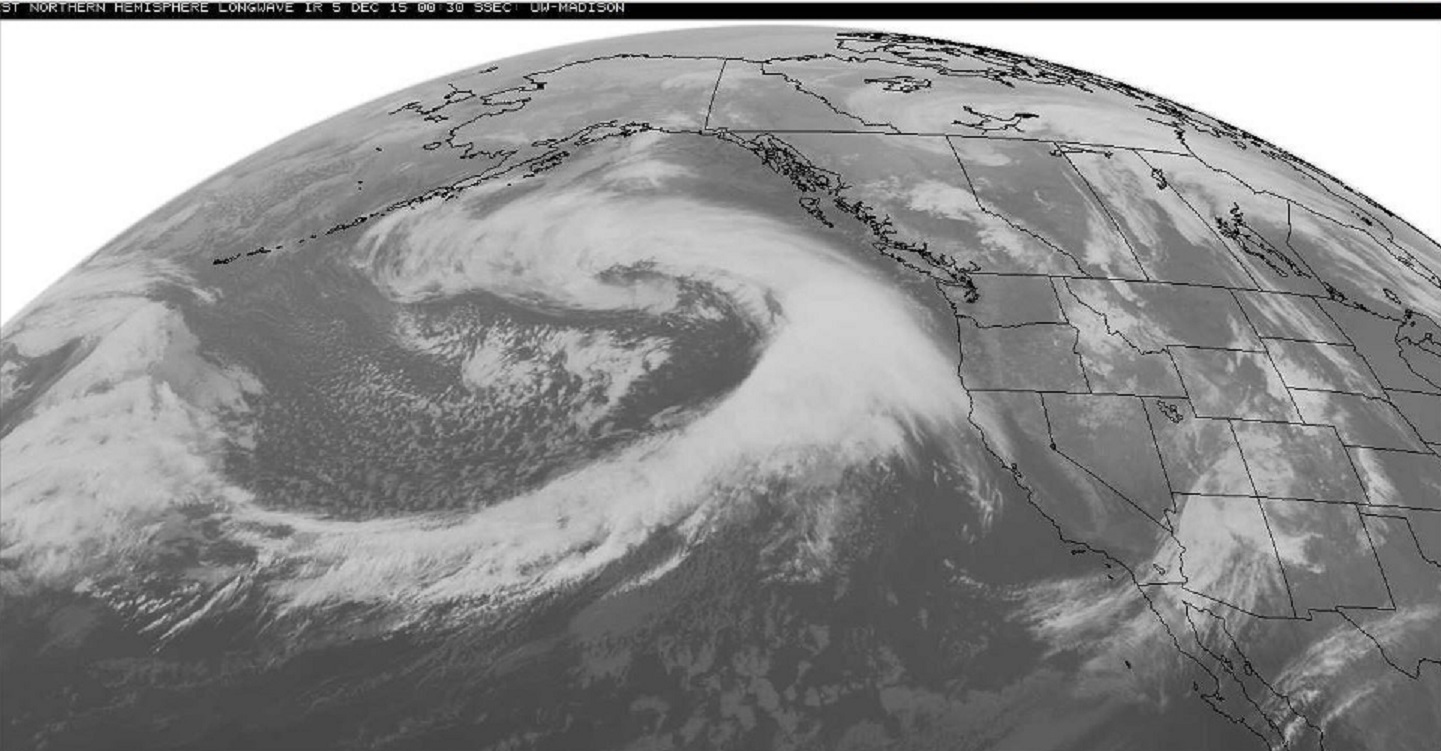
Now the Second storm in the series is about to roar ashore
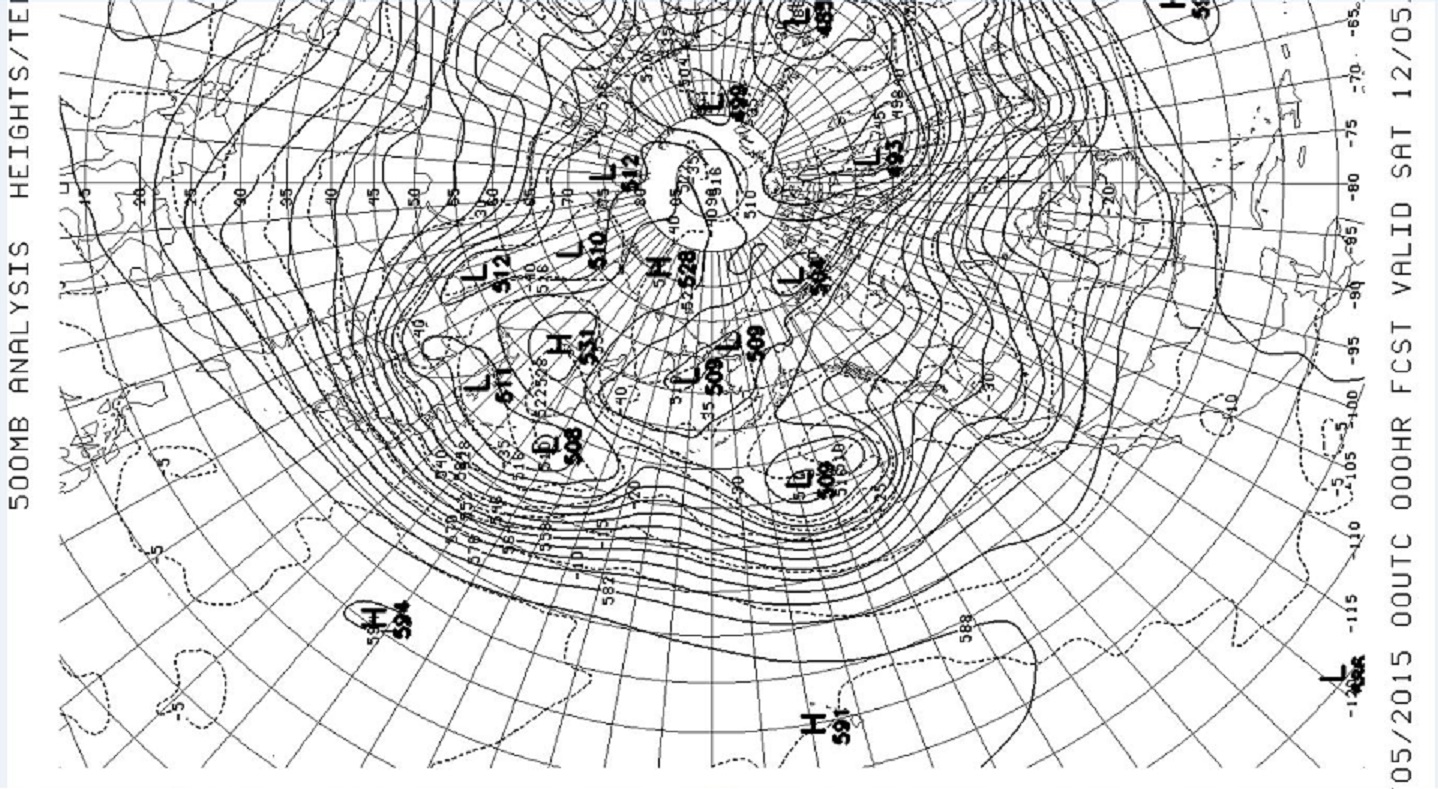
As forecast, the jet stream across the Pacific has narrowed into a more concentrated flow directed right at the West Coast.
The forecast map from 2 days ago showing the same west to east jet steam as the current analysis above.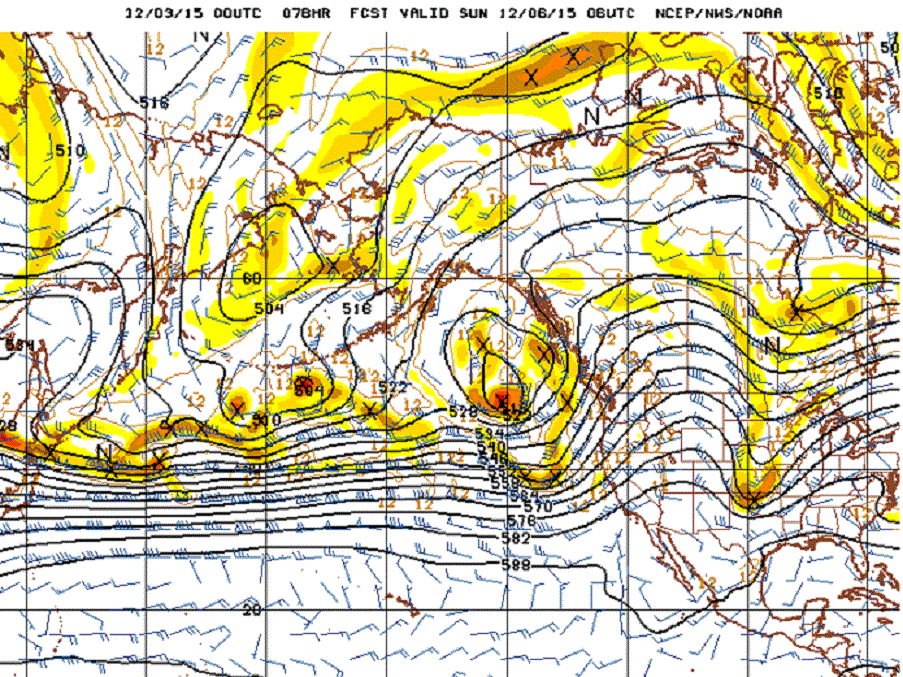
So the El Niño Winter has begun. The current storm track is way too far north to have much impact on Southern California at the moment. But with the recent November SST (sea surface temperatures) record in the 3.4 Niño region. Impact on Los Angeles and San Diego can only be considered imminent.
Learn more in my latest e-book El Niño: The WILD side of the weather cycle…
What we know, what we don’t, and WHY you should care!
I show how this years Pacific water temperatures compare to the 1982 and 1997 events and highlight the kind of weather episodes that these stronger El Niño’s tend to bring.
If you like the blog you will love the book.
Wild Bill.
