Monthly Archives: March 2019

Use the internet to follow this springs severe weather threat

March 28, 2019  Hers is a quick look at how to use the internet to follow this springs severe weather threat across the country and perhaps even in your own local area.

1st stop, … Storm Prediction Center, … https://www.spc.noaa.gov/

Find it, get familiar with it, and bookmark it to your favorites.

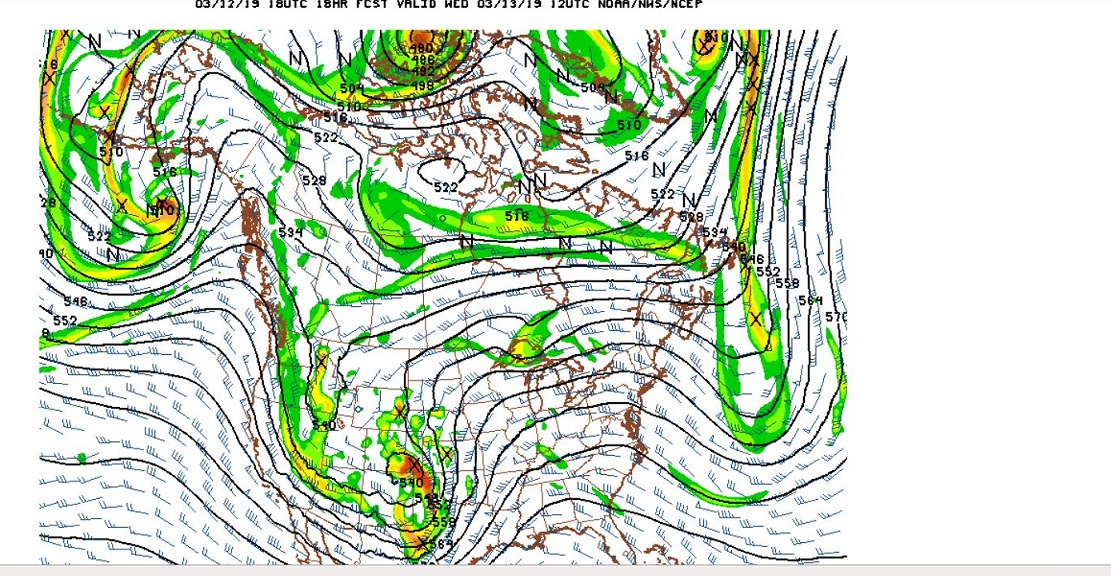
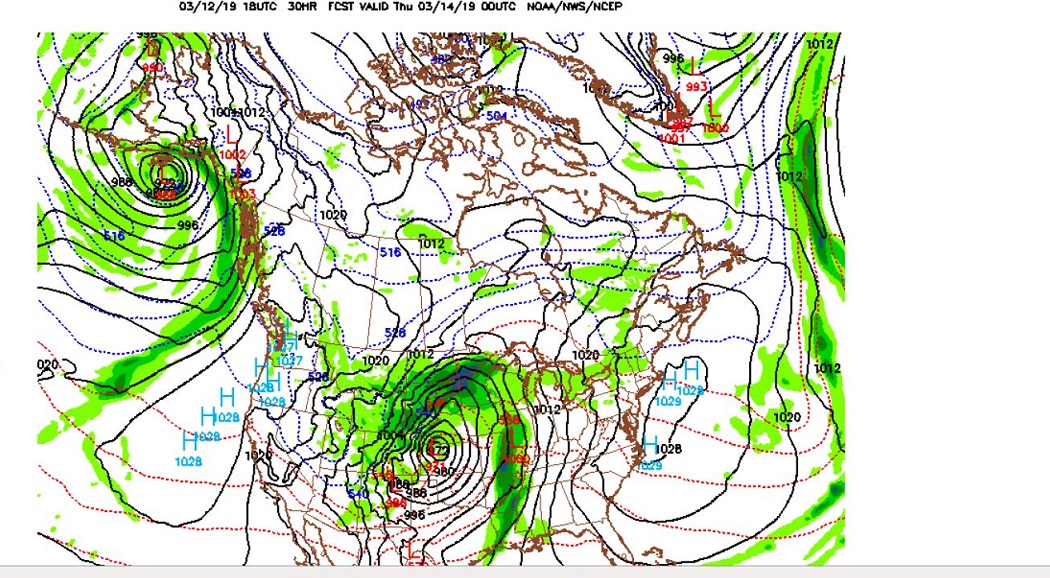
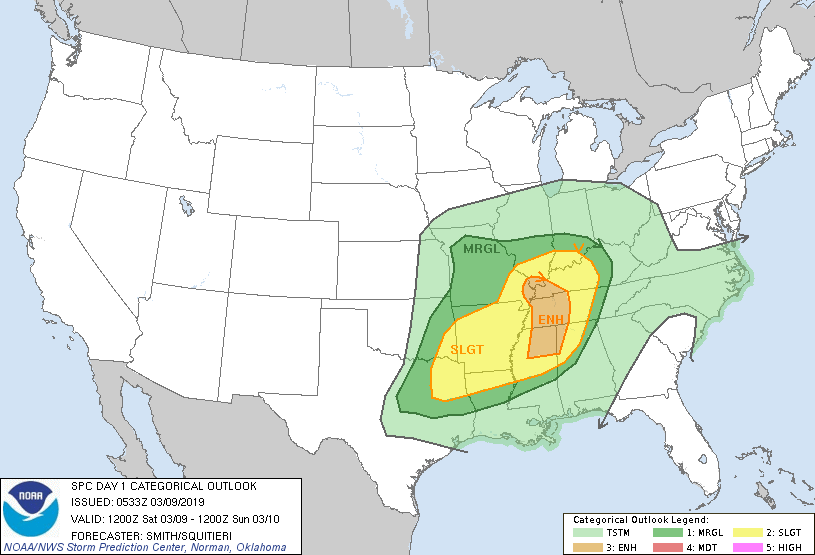
During the spring and early summer keep an eye on the daily “Convective Outlooks”.  The redder the colors, the bigger the  risk of bad weather.  The color code at the bottom shows six shades of color, from light green to dark red.  The two shades of green outlines depict a lower chance of a damaging storm, the redder colors are reserved for the higher chances of dangerous conditions.  In the example below, The Prediction Center coded the outlook  with darker yellow indicating an enhanced risk of severe storms.  The day of this outlook, there were 49 reports of tornadoes,  and 237 reports of severe weather. So the outlook does not have to be moderate or high, the redder colors,  for significant weather to occur.

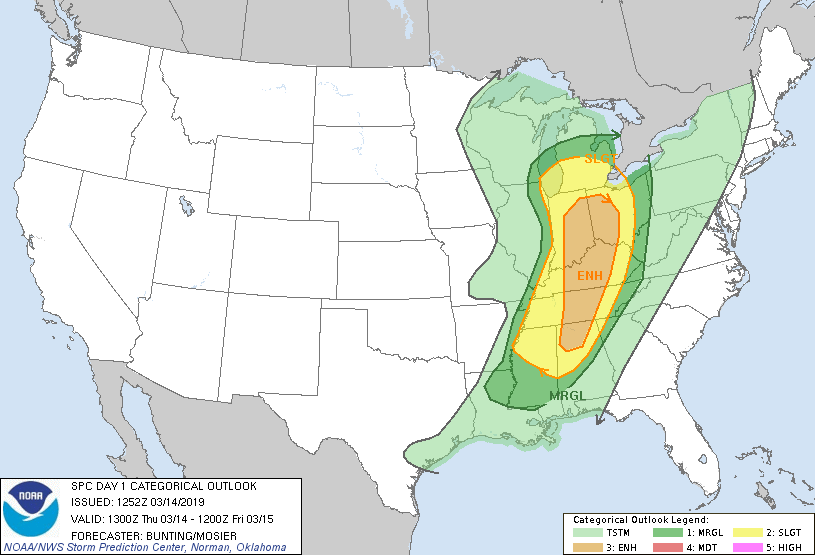
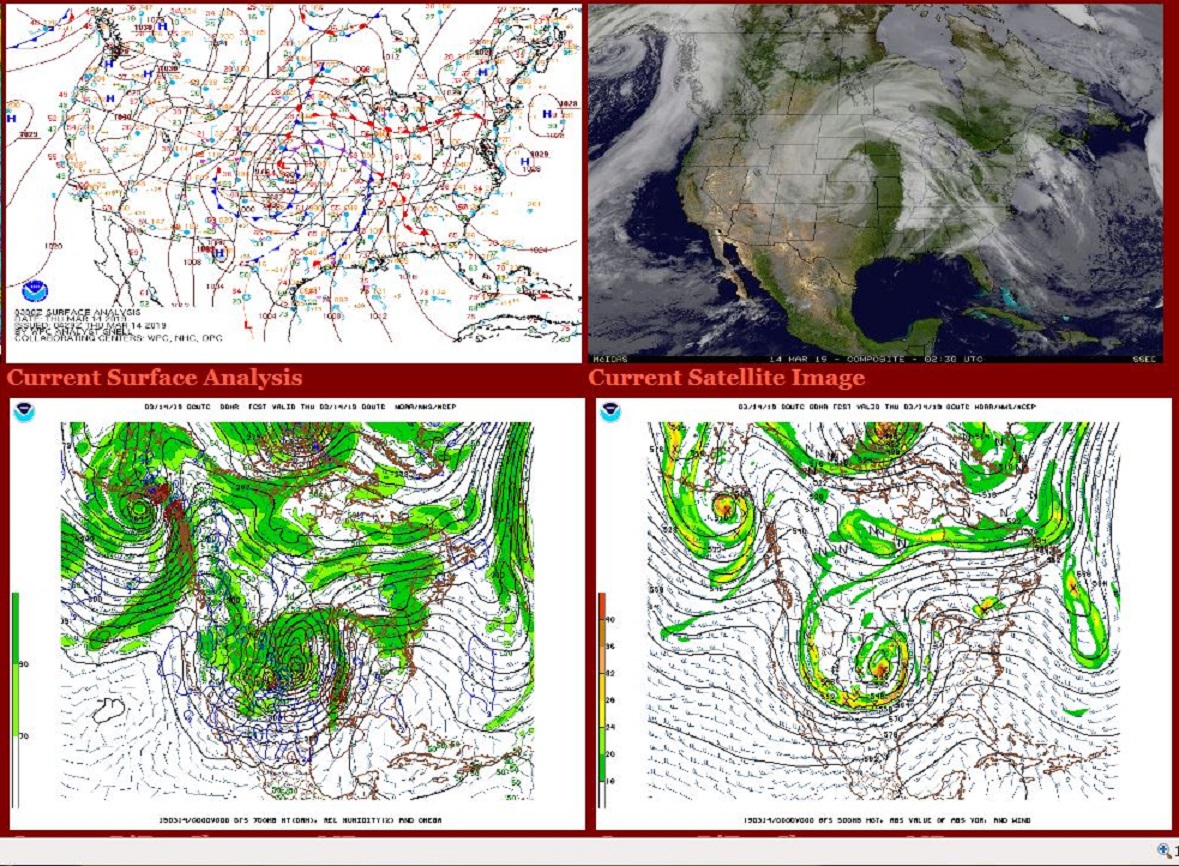
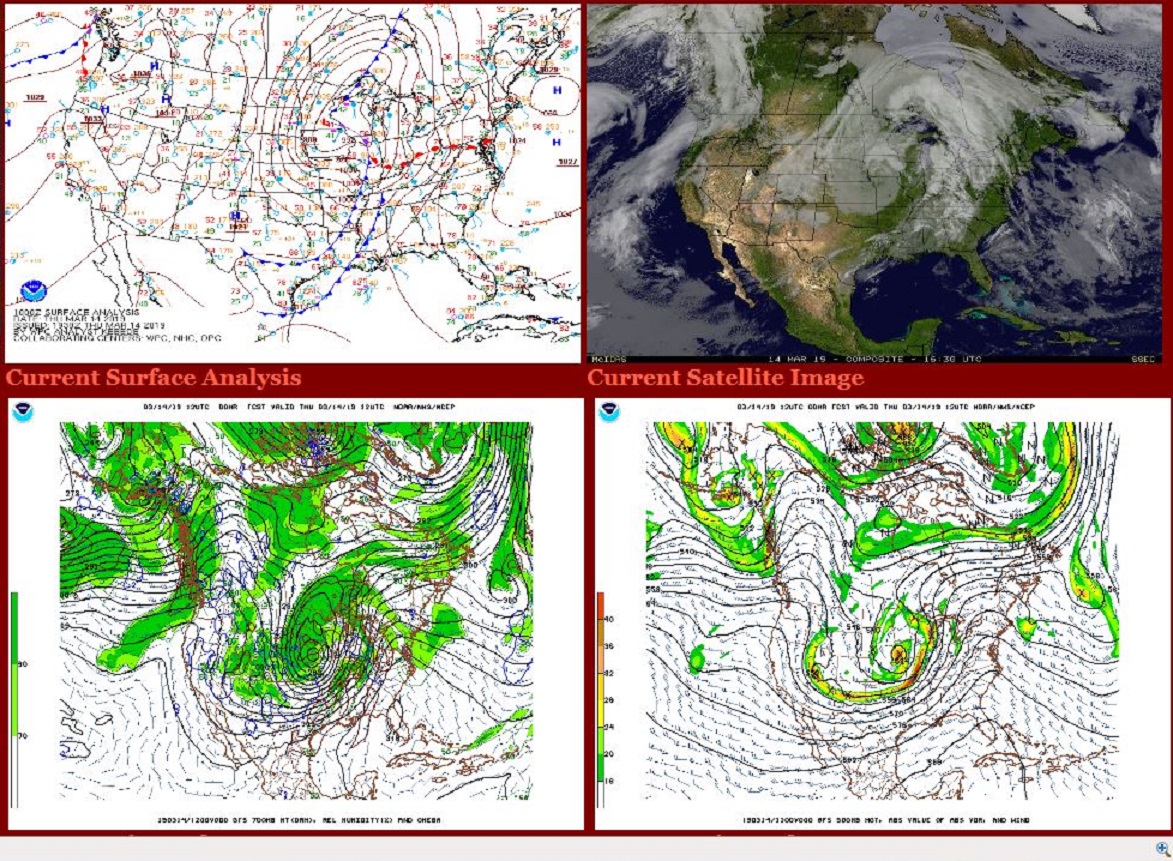
The above is the Day 1 Outlook was for Thursday March 14, 2019, which we will look at a little closer down the page a bit.

If you are in or near the Outlook area (especially the day 1 outlook) it is time to keep a closer eye on your current weather.  You will want to monitor both the Storm Prediction Center (SPC) and your local National Weather Service(NWS).   SPC is responsible for issuing the Severe Thunderstorm or Tornado Watches. But it is you local NWS office that issues specific warnings when storms are identified as potentially severe.

2nd step,… National Weather Service Home Page,.. https://www.weather.gov/

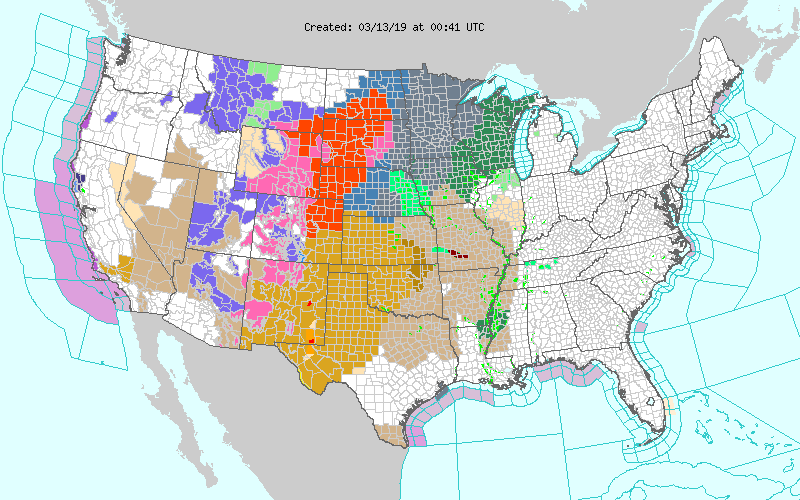
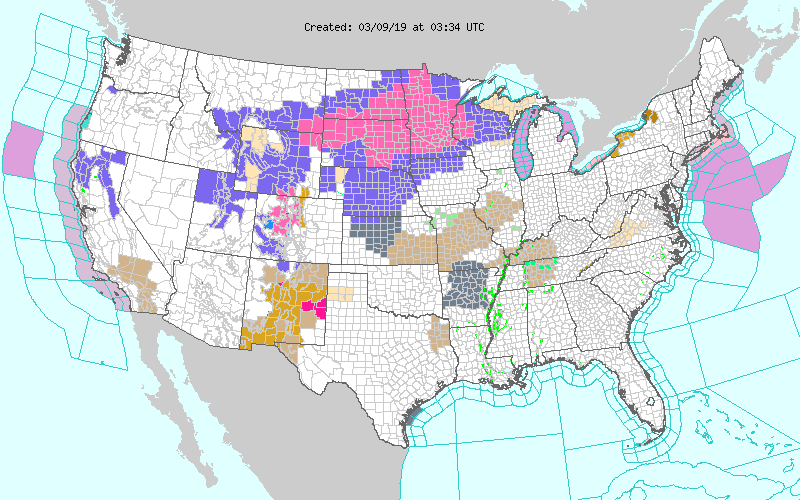
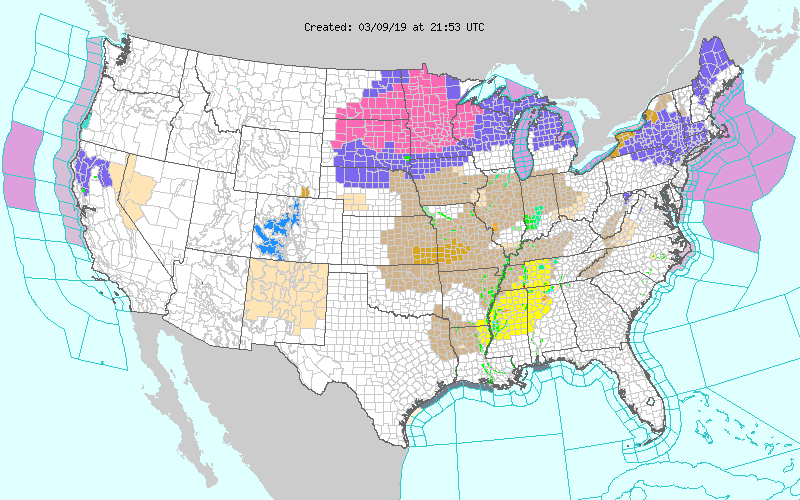
Again,  …  Find it, get familiar with it, and bookmark it to your favorites. Put this favorite bookmark near the page,  Storm Prediction Center (SPC),  we just saved above.  Once you determine your location relative to the Convective outlook it is time to ask the question,  Am I included in any Watches, Warnings, or Advisories?  This is where the NWS home page can be instrumental.  It is a one stop shop for all Advisories issued by any office across the country.  The Warning page below is actually for the 9th not the 14th, but still an example of a Tornado Watch, shown with yellow shading, across parts of Alabama, Mississippi, and Tennessee.

So we have gone from Day 1 Convective Outlook to a Tornado Watch,  time to dig a little deeper.  If you still have power and access to a local TV  station, one safe way to monitor the situation is just keep TV tuned to the station known for their news and weather coverage.  If a Tornado Warning is issued in their broadcast area they will cut into regular programing and show you where the problem is. Most TV stations have access to the newest technology and in a serious situation this option is hard to beat. But the purpose of this blog however is to show how to take advantage of the internet when other information sources may not currently available.

So, a Tornado Watch has been issued for your area, and now you have reason to believe Warnings are also posted. It is now time for the all important step three.

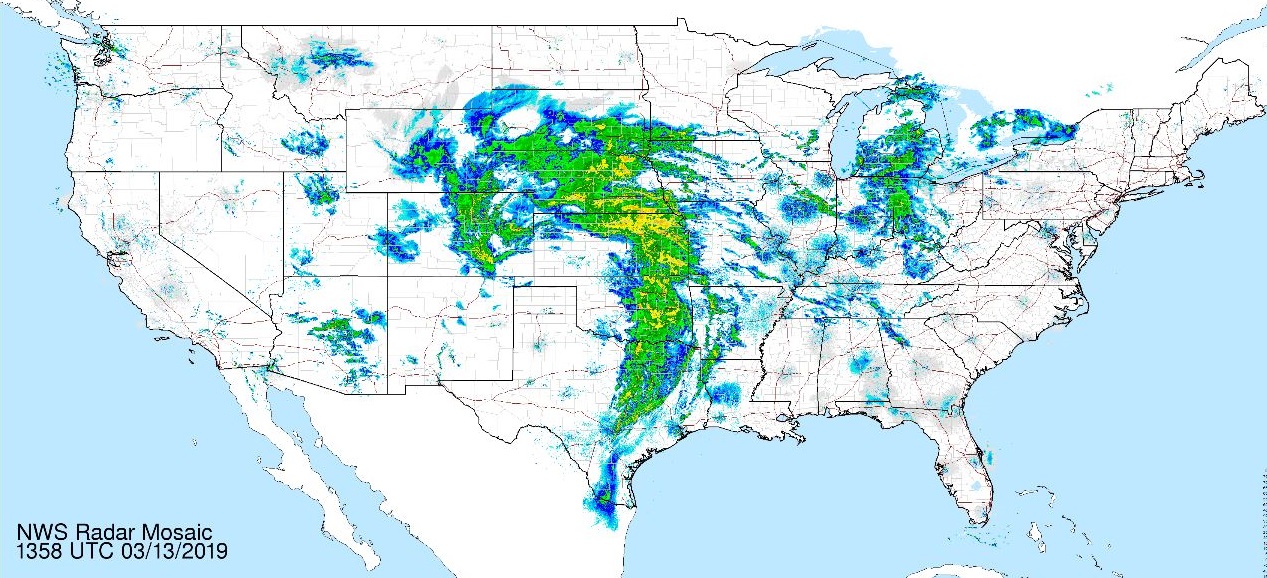
3rd phase, …start paying attention to a presentation of your National Weather Service radar.  You have national, regional and local radar displays to choose from.  When bad weather develops or moves into your local area, the local radar option is best.  The reflectivity mode not only shows precipitation  intensity,  but also which storm cells are currently covered by a specific Warning.

Below I have gathered a few examples of tornado producing thunderstorms that have just occurred in recent weeks. My hope is that these illustrations may help you identify and track severe storms with just an internet connection and various NOAA websites..

March 14, 2019 …0506 PM CST, …KBMX Birmingham Alabama weather radar.               Reflectivity, or precipitation to the left, Storm Relative Velocity, rotation, to the right.  For the illustration below,  I choose Birmingham NWS Radar and selected Reflectivity.  Then I open a new tab or window and selected the Storm Relative Velocity and placed it next to the Reflective window.  With the two windows side by side, you can see the Tornado Warned storm has heavy precipitation, red, even a hint of purple, possible hail, north of the “ING” in Birmingham on the left panel.  Now look to the same area on the Relative Velocity panel to the right, the red and bright green colors close together north of the “ING” in Birmingham  indicates strong wind blowing in opposite directions over a very short distance very near our potent storm.  Analysis would suggest a severe, rotating thunderstorm capable of large hail and a possible tornado. Several  tornadoes did indeed occur shortly after 5pm local time across Blount County Alabama in associate with the Tornado warned storm illustrated below.

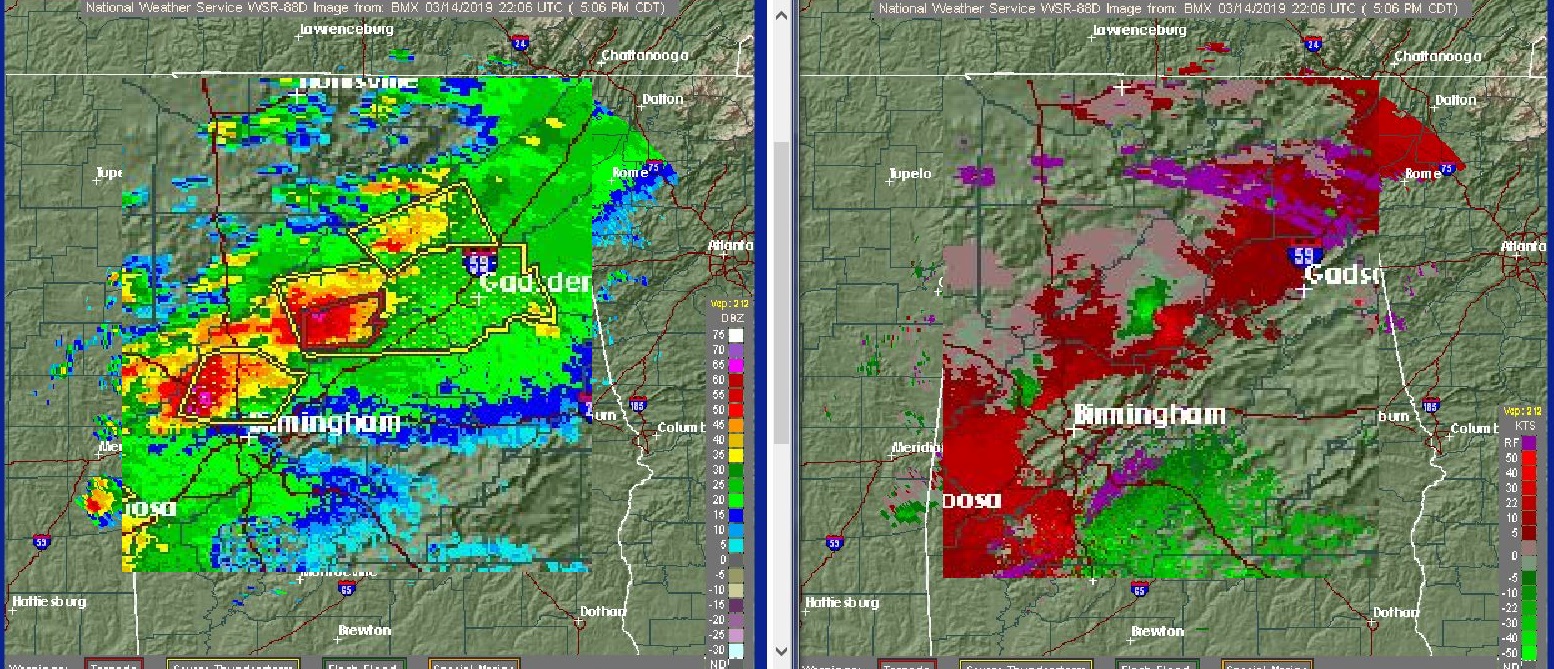
After examining the above, you may ask, what about the green, red couplet on the Storm Relative panel just northwest of the “B” in Birmingham?  Well that also indicates a severe storm with a high probability of rotation.  The NWS is closely monitoring that storm respecting it’s potential with a yellow box, a severe thunderstorm warning.

Some 45 minutes later it is the southern storm cell that carries the Tornado Warning. The lead cell, now approaching Gadsden, still shows signs of broad rotation but is only covered by a Severe Thunderstorm Warning.  Tornadoes were reported in St. Clair County Alabama in association with the Tornado Warned cell in the graphic below.

March 14, 2019, … 0553 PM CST, …KBMX Birmingham Alabama weather radar.

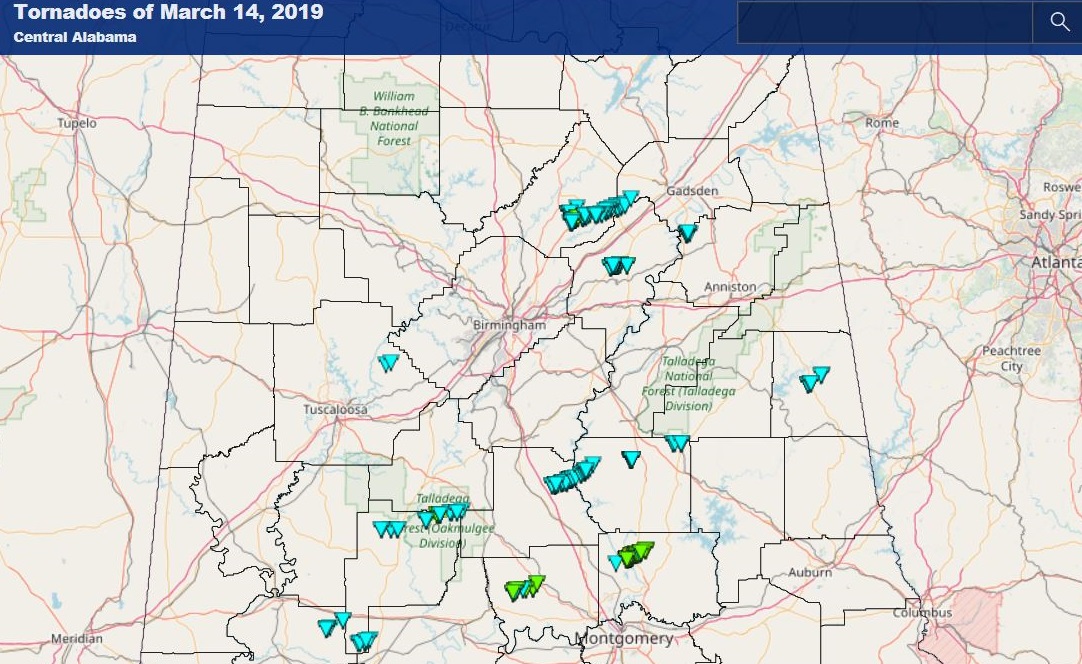
Below a map of the 15 tornadoes reported in Alabama on Thursday March 14, 2019. The radar snapshots above focus on the two tornado tracks north of Interstate 20 east of Birmingham.

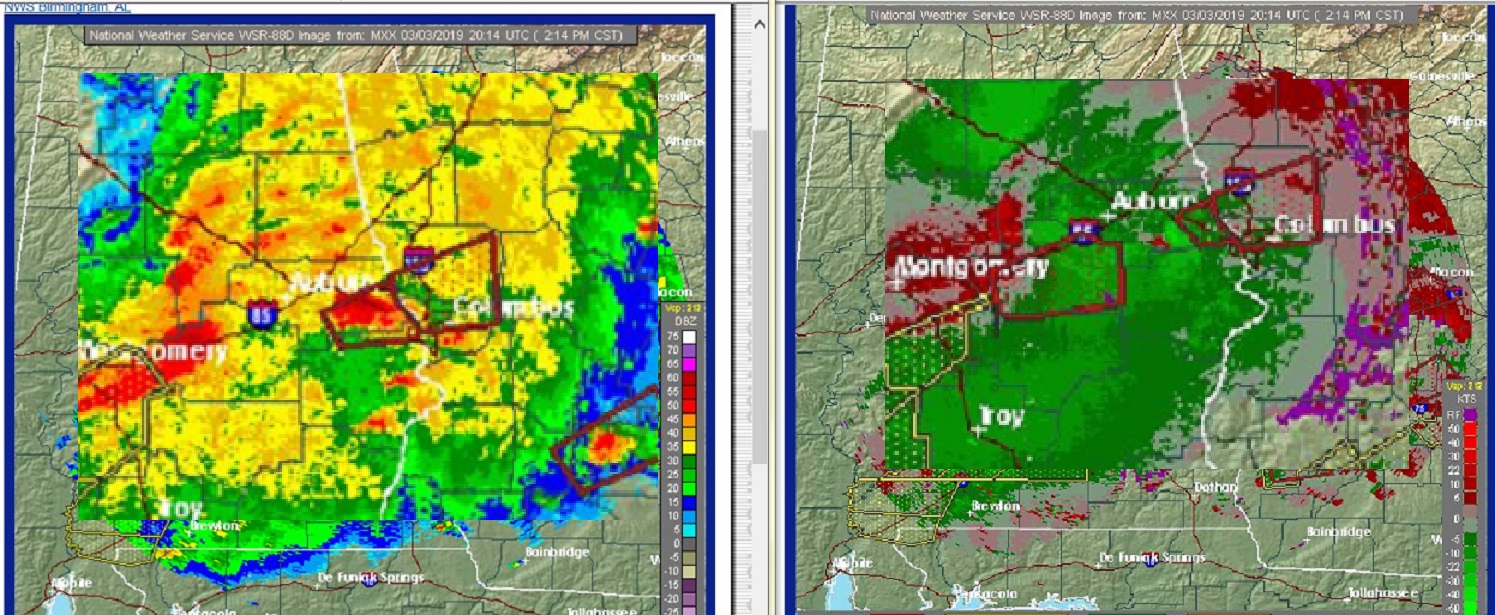
One more example below shows local radar representation of the storm that killed 23 on that Sunday in early March.  This radar snapshot was taken about the time the storm was at it’s EF4 strongest, causing destruction and taking lives.

March 03, 2019  …0214 PM CST, …KMXX Maxwell AFB weather radar also called East Alabama. Again like the above examples above, Reflectivity, or precipitation to the left, Storm relative Velocity, rotation, to the right.  The red green couplet in the velocity frame south of the “bu” in Auburn identifies to location of the damaging and in this case, deadly tornado.

In a damaging weather situation, SPC will track the severe potential along with your local NWS office. SPC uses what they call Mesoscale  Discussion (MDs)  to give insight to what active weather is occurring or expected to occur within an official Watch area.  Below is a rather unsettling discussion that was issued as the Lee County Alabama tornado was at it strongest.

The Mesoscale Discussion (MDs)  issued 5 minutes after the radar depiction above.

Mesoscale Discussion 0148 …   0219 PM CST Sun Mar 03 2019

Mesoscale Discussion 0148
NWS Storm Prediction Center Norman OK
0219 PM CST Sun Mar 03 2019

Areas affected…far east-central AL and far western GA

Concerning…Tornado Watch 78

Valid 032019Z – 032045Z

The severe weather threat for Tornado Watch 7, 8 continues.

SUMMARY…An intense tornado with experimental tornado guidance
suggestive of wind speeds 125-175 mph based on recent volume scans
of rotational velocity and the significant tornado parameter.

DISCUSSION…A very intense supercell tornado will continue to move
through a very favorable environment.  Confidence is high for a
significant tornado based on rotational velocity continuity, the
favorable mesoscale environment, and a relatively unimpeded warm
sector along the warm front.

..Smith.. 03/03/2019


1st stop, … Storm Prediction Center, … https://www.spc.noaa.gov/                                              Monitor Convective Outlooks and anticipate where possible Weather Watches may be issued.

2nd step,… National Weather Service Home Page,.. https://www.weather.gov/             Identify where specific Watches, Warnings and Advisories are in effect.

3rd phase, …start paying attention to a presentation of your National Weather Service radar.  https://www.weather.gov/Radar.  Try to become more familiar with radar options the NWS offers.  You will gain confidence at reading the radar as you witness spring storms in your area.  Pay attention to what storms get warned on and when.  And make a mental note of the storm cells appearance on your local radar.

I have other examples and will revisit this subject again soon.


Wild Bill

Big wind storm created a blizzard and an epic flood.

March 22, 2019 … A brief look back at the big wind storm that brought a blizzard and an epic flood across the state of Nebraska and parts of the Upper Midwest .

The Spring season arrives about the same time every year, so what you may ask just happened to Nebraska and the Upper Midwest in the past 10 days.  The following graphics from the Climate Prediction Center sheds some light on the question.  Simply stated, above normal precipitation and below normal temperature for much of the winter left all of the upper Midwest and the Northern Plains blanketed with snow and frozen solid.  The winter’s character is illustrated quite well by the magnitude and coverage of temperature and precipitation departures over  the last 30 days, as well as the last 90 days.


So, over 90 days or three months,  three winter months, the already cold region received above normal precipitation frozen in place by a below normal  Arctic chill that settled in with the visit from the Polar Vortex during the later days of the month of January.   What followed was weeks of frigid February temperatures and additional pacific storms. Then,  all of a sudden this  mammoth early spring storm whips itself into a frenzy reaching unusual low barometric pressure for so early in the storm’s life cycle,  or in other words the storm got really strong really quick.   The west side became cold, wintry and white with hurricane gusts. The warmer east side surged northward on gusty winds.   This  drove above freezing temperatures well north over frozen, snow covered ground of Nebraska.   Rain along with  thunderstorms  produced immediate runoff because of frozen ground.   The storm attacked Nebraska with all weapons, both sides. Wintry and white on one side, mild and melting on the other.

The following tables are Monthly Climate Data for Norfolk, Nebraska for February and March.  Norfolk was ground zero for the beginning of the dangerous flood.  Direct your attention to the DEP ( Departure from normal) column #5, notice most of the month shows negative values,  that means below normal temperatures.  Now start at about February 15th and continue down until March 07th, you are looking at three solid weeks of double digits below normal departures.   Notice during this stretch that there are no daytime highs above freezing.  The snow depth at Norfolk is not overly impressive, but still up to 4 inches of snow depth a day and a half before the storm hit.

Then the epic storm dropped over two inches of rain in a matter of hours on top of that snow cover and frozen ground.  The day of the storm the high temperature reached 53, or 21 degrees above freezing. This would be the first day this mild since February 1st, a six week stretch.

A look at the storm evolution using a four panel presentation. The top row, surface map and snapshot satellite picture, followed by 700 and 500mb flow for times indicated.

March 13, 2019 00z

March 13, 2019 12z

March 14, 2019 12z

March 14, 2019 12z

Below two glimpses of the National radar summary during the day on March 13th, note that Nebraska is covered by radar echoes.  Eastern Nebraska received rain, the western counties of the state saw the snow with gale force winds and whiteout blizzard conditions.

Finally, the recently issued outlook for Spring flooding from NOAA’s River Forecast Center, shows more problems ahead.  Snow melt with warmer temperatures and any rain on still frozen ground could still bring flooding to the Northern Plain, the Mississippi Valley and parts of New England.

Another opportunity for seasonal flooding may be just weeks away when the warmer temperatures of spring reach the deep snow pack of the mountainous West. The Rockies, parts of he Cascades,  and the Sierra have all received above normal precipitation.  Below, snow depth this passed Friday in Sequoia National Park.

Same picture, nearly same time last year.

Website to follow Mineral King webcam:   http://www.mk-webcam.net/

Keep an eye on our active weather pattern, more surprises may be just days away.

Other websites that helped in the creation of this blog entry:

https://www.cpc.ncep.noaa.gov/                                                                                                                        Climate Prediction Center

https://www.weather.gov/oax/                                               https://w2.weather.gov/climate/index.php?wfo=oax                                                                      National Weather Service Omaha

https://www.weather.gov/Radar                                                                                                              National Radar

https://www.wpc.ncep.noaa.gov/archives/web_pages/sfc/sfc_archive.php                         Weather Prediction Center

https://www.ssec.wisc.edu/data/us_comp/small                                                                               Space Science and Engineering CenterUniversity of Wisconsin-Madison

https://mag.ncep.noaa.gov/                                                                                https://mag.ncep.noaa.gov/model-guidance-model-area.php                                                             Model Analyses and Guidance

That all for now,

Wild Bill

PS … A short 4 years ago Nebraska was experiencing record warm temperatures in the middle of March 2015.  Just an example of the variability of weather from year to year.

The graphic shows a record high of 92 degrees at the Norfolk(KOFK) location on March 16, 2015. This broke the daily record by 8 degrees and also became Norfolk’s earliest 90 degree reading of the season.

OK, now I am done.

Wind gusts to hurricane force from West Texas to Colorado

March 13, 2019  The potent wind storm has produced wind gusts to hurricane force over a wide area of real estate. The following is just a sample of what today’s storm has unleashed from the plains of west Texas to the Colorado Front Range.

In west Texas, Amarillo KAMA gust to 79mph,  2:53pm and 3:53pm, … Pampa KPPA gust to 72mph 2:35pm and 3:15pm

Along the Front Range, …Colorado Springs KCOS, gust 79mph 1:54pm, … Pueblo KPUB gust 74mph at 1:04pm

More Colorado observations, Limon KLIC gust 76mph at 1:41pm,  and even Denver KDEN  gust to 75mph at 10:53am

Note, … Texas skies were at worst were Partly Cloudy when the strongest winds occurred, But across Colorado falling and blowing  snow combined with the strongest winds to create sever blizzard conditions.  Folks will be talking about this storm for quite sometime.

Above observations retrieved from following NWS website:  https://www.wrh.noaa.gov/map/?wfo=lox&obs_type=weather&obs=true

Below,  satellite pictures show the evolution of the storm during the day Wednesday.

March 13, 2019 morning or 1430z

March 13, 2019 early afternoon or 1830z

March 13, 2019 late afternoon or 2230z

A snap shot of Wednesday’s national radar summary also showing the evolution of the storm during the day.  Tried to show similar times, 14, 18, and 22z.

So add another storm to the weather history of mid March, … The so called Storm of the Century buried much of the eastern seaboard March 13, 1993.  Two F5 tornadoes occurred in Kansas on March 13, 1990.

That’s all for now, …

Wild Bill

Deep low pressure brings a potent spring wind storm.

March 13,  2019       Deep low pressure brings a potent spring wind storm to the west and central portions of the country.  Two big bundles of jet stream energy are converging over the Western half of the North America today.  This will create an explosive storm that will spread its windy influence from the Rio Grande  to the Canadian border.

First,… the jet stream early Monday the 11,  which shows the upper low off San Diego, and the short wave racing across North Pacific toward the Pacific Northwest.

March 11, 2019 12z or early Monday morning,

Second,… same chart 24 hours later, Tuesday morning,  the upper low pushes into Northern Mexico,  while the “kicker” shortwave is already diving into Cascades.

March 12, 2019 12z or early Tuesday morning,

Third,… satellite pictures from Monday and Tuesday show both systems in the Eastern Pacific drawing ever closer to one another as they push into  Western North America.

March 11, 2019 18z or near midday Monday

March 12, 2019 18z or near midday Tuesday,

Fourth,…  forecast models for Wednesday the 13th showing the two disturbances merging over the west central US.  Go to your favorite weather modeling site and put the maps  in motion. The next 24 hours will be most impressive. Two distinct and separate disturbances suddenly become one massive storm.

12z or early morning Wednesday,

00z of the 14th, which is actually early evening Wednesday

Five, …under the impressive new upper level disturbance is a deep surface low pressure system.  In the fine print, the central pressure of the storm by late Wednesday is forecast by the GFS to be about  972 millibars .  That pressure compares to a Category two hurricane.  Now pressure differences are spread over a much wider area with our jet stream driven storm.  So one would not expect sustained hurricane force winds.  But wind gusts to near hurricane force may be possible not only in or near thunderstorms, but also on the north and west side of the storm system where the pressure gradient becomes the tightest at the height of the storm.

So, lots of Warnings and Advisories for both Winter and Spring severe weather.

So,  please be weather aware on Wednesday, especially if your business takes you to any part of the country that will be under some form of weather warning during this massive storm.

Wild Bill…

A week has passed and the Eastern Pacific weather pattern lingers.

March 08, 2019

A week has passed since my last blog on the current Pacific weather pattern.  The Blocking Eastern Pacific weather pattern lingers, and that means more activity weather for many parts of the country. First chart is of course the 500 mb flow across the Pacific.  I have used the blue color to outline the now familiar Omega configuration of the Blocking pattern. The red line shows the tropical connection that also lingers in the Eastern Pacific.  The 500 mb chart is from  Friday morning at 12z UTC.

The GOES West snapshots below illustrates how the trail of clouds and moisture runs from south of the Hawaiian Islands northeast all the way to the Central US. For reference it is 2500 miles from Hawaii to California , so this plume of moisture may stretch as much as 4000 or 5000 miles from the Equatorial Pacific to Central portions of North America.  The first picture is from Thursday evening, 00z UTC March 08.

The second frame is from late Friday afternoon or 2200z UTC.  In this second picture the cloud pattern over the Alaskan panhandle actually shows the same Omega configuration . It also shows moisture surging into North America as our Pacific disturbance moves east.

Along with keeping the west coast active with snow and rain, and this past week even a round of thunder and lightning over Southern California.  This most recent system is headed toward the Central US. with a threat for severe spring weather. So,  similar to last weekend,  a storm system with a Pacific and Arctic connection will lead to more active weather including the threat of tornadoes.  This weekend Saturday appears to be the day with the greatest threat of severe weather. The threat for tornadoes is  greatest in the center of the highlighted area in the Storm Prediction Center’s graphic below.

Along with another round of severe weather,  moisture will also mix with the arctic air leading to more snow for the Upper Midwest. Winter Storm Warnings spread across parts of seven states.

On the lighter side, the snow just keeps piling up across the mountains of the west.

The Mineral King webcam is located at an elevation of 7830 feet in  Southern Sequoia  National Park. The Park is reporting a snow depth of 108 inches, or 9 feet.

Friday March 08, 2019 at1209pm

Below, the same location pictured last year in early March of 2018, note not only is the cabin mostly visible, you can also see the outline of the corral used in the summer months.

Monday March 05, 2018

A few weeks earlier last year when the slopes of the Sierra were void of snow in the middle of February.  All this to illustrate what a stormy 5 or 6 week stretch we have seen in the west since late January.

February 18, 2018

Mineral King and Farewell Gap webcams can be found at:

http://www.mk-webcam.net/

If you like the blog you will love the book.

Cover2 redo

More pictures from the buried western mountains.

March 02, 2019

The view of Half Dome from the Sentinel Dome webcam in Yosemite National Park has been abruptly obscured by the blockbuster storms of early and middle February.

January 22, 2019 … Snow depth in Yosemite National park growing In late January, but the view across the valley remains stunning.

February 07, 2019… Two short weeks later, the snow depth has grown considerably. Only the very top of Half Dome and the distant crest of the Sierra remain visible. 

February 18, 2019…  After a couple of more February storms, no view but a snow bank and blue sky.

March 02, 2019… As recently as Saturday the snow bank remains in place.

Current model runs continue to show an active weather pattern across California and the Sierra for the next week or two. It should be fun to see how much deeper the snow gets before spring melting returns the mighty view to the Sentinel Dome webcam in Yosemite National Park.

Big thanks and shout out to the Yosemite Conservancy.  Photos on this blog retrieved from following websites:

https://rockyags.cr.usgs.gov/dashboards/WebCam.htm

https://www.yosemiteconservancy.org/webcams/half-dome


If you like the blog you will love the book.

Cover2 redo


Parade of storms continues nationwide in early March

Parade of storms continues nationwide in early March

Friday March 01, 2019

Before we can take a breath, relax and look back an incredible February of weather extremes, March is about to roar like a lion.  What is called an Omega ( looks like Greek letter Omega ) Block has been a semi-permanent feature in the Eastern Pacific for weeks now.  I have made the attempt to use blue arrows to show path of cold arctic air and red for the tropical moisture, sometimes called The Pineapple express.  The ridge which makes up the Blocking pattern is not only bring above normal temperatures to Alaska, but notice it also directs  air from the Arctic southward toward the United States including the Pacific Northwest.

Below is the 500mb chart from very early on Friday March 1, 2019

GOES 17 or GOES west IR imaging for midday Friday March 1st shows the next storm lurking west of California.  After impressing central and southern California, this storm will cross the country during the first weekend in the month of March bring a variety of adverse weather pretty much from coast to coast. Another shot of impressive Arctic air will plunge into the central and eastern US following the storm. Early March will look and feel a lot like much of February did for across the nation.

Below I offer one example of what this weather pattern has meant to one of our National Parks. At 6000 feet in the Southern Cascades of Oregon, the south entrance to Crater Lake, the webcam pictures tell quite a story.  First, this year, then last March, and finally the El Niño season of 2016.

The observation from the Anne Springs Entrance shows a snow depth of 129 inches on Friday March 1st.  Up at the rim of the crater the report is 140 inches of snow on the ground.

Last  year on March 1st, 2018,  notice the fallen tree at an angle and compare to picture above.

And finally same view on March 01, 2016, this was the winter of the strong  2015-2016 El Niño.  So this year’s short, weak El Niño has out performed the stronger record event in terms of snow pack at least at this location at this point in the season.

You can learn more in my e-book El Niño:  The WILD side of the weather cycle…
What we know, what we don’t, and WHY you should care!

The book was written for the record 2015-2016 event, but much of the material is also relevant for this year’s much weaker event.

We will review some of this winter’s extreme weather in the coming days. We saw record February snow in several locations, including a brief surprise accumulation in Las Vegas, Nevada. We saw historic rain and flooding across parts of the south and in California. We have also experienced a record cold polar vortex.

So in brief, it has been stormy, it is stormy, and it will continue to be stormy, until the season changes, the arctic air stays in the arctic, and the affect of this current El Niño begins to fade.

If you like the blog you will love the book.

Cover2 redo