March 22, 2019 … A brief look back at the big wind storm that brought a blizzard and an epic flood across the state of Nebraska and parts of the Upper Midwest .
The Spring season arrives about the same time every year, so what you may ask just happened to Nebraska and the Upper Midwest in the past 10 days. The following graphics from the Climate Prediction Center sheds some light on the question. Simply stated, above normal precipitation and below normal temperature for much of the winter left all of the upper Midwest and the Northern Plains blanketed with snow and frozen solid. The winter’s character is illustrated quite well by the magnitude and coverage of temperature and precipitation departures over the last 30 days, as well as the last 90 days.
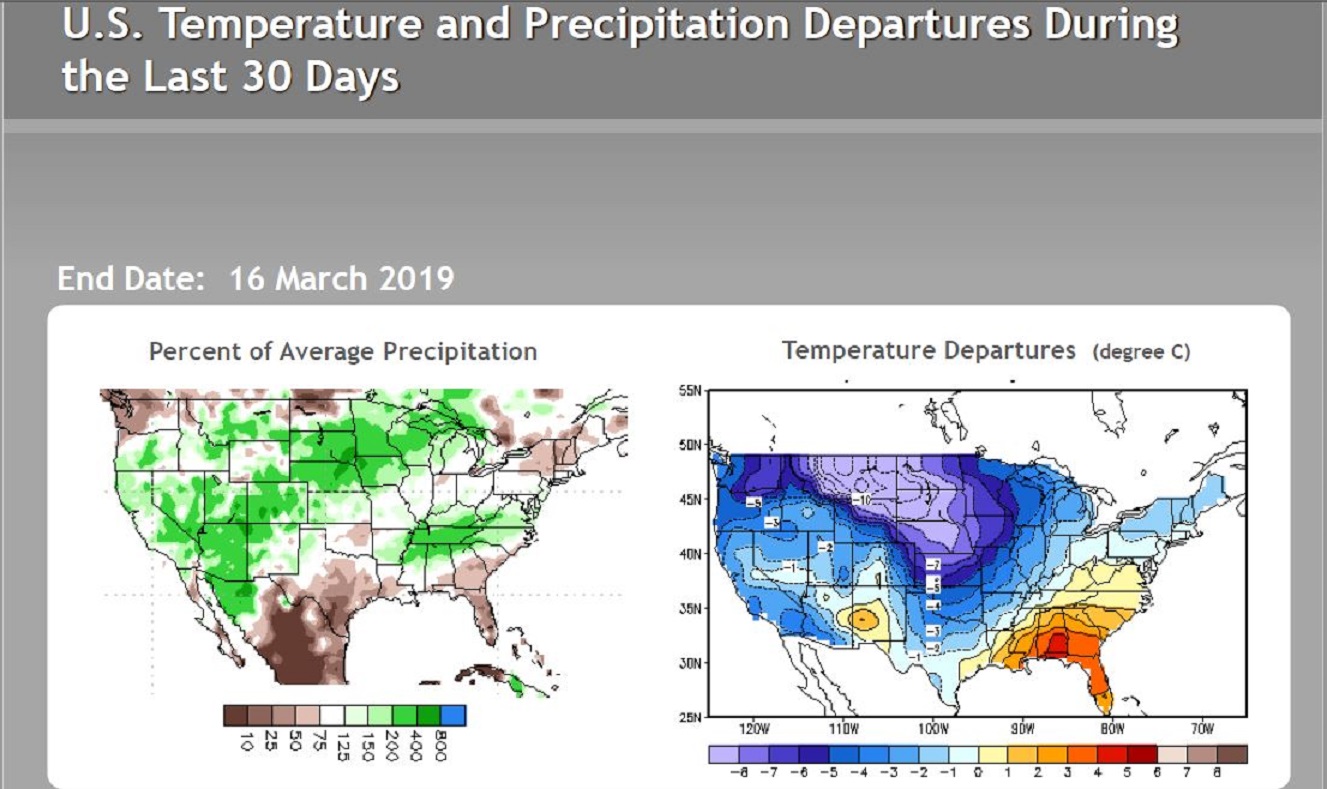
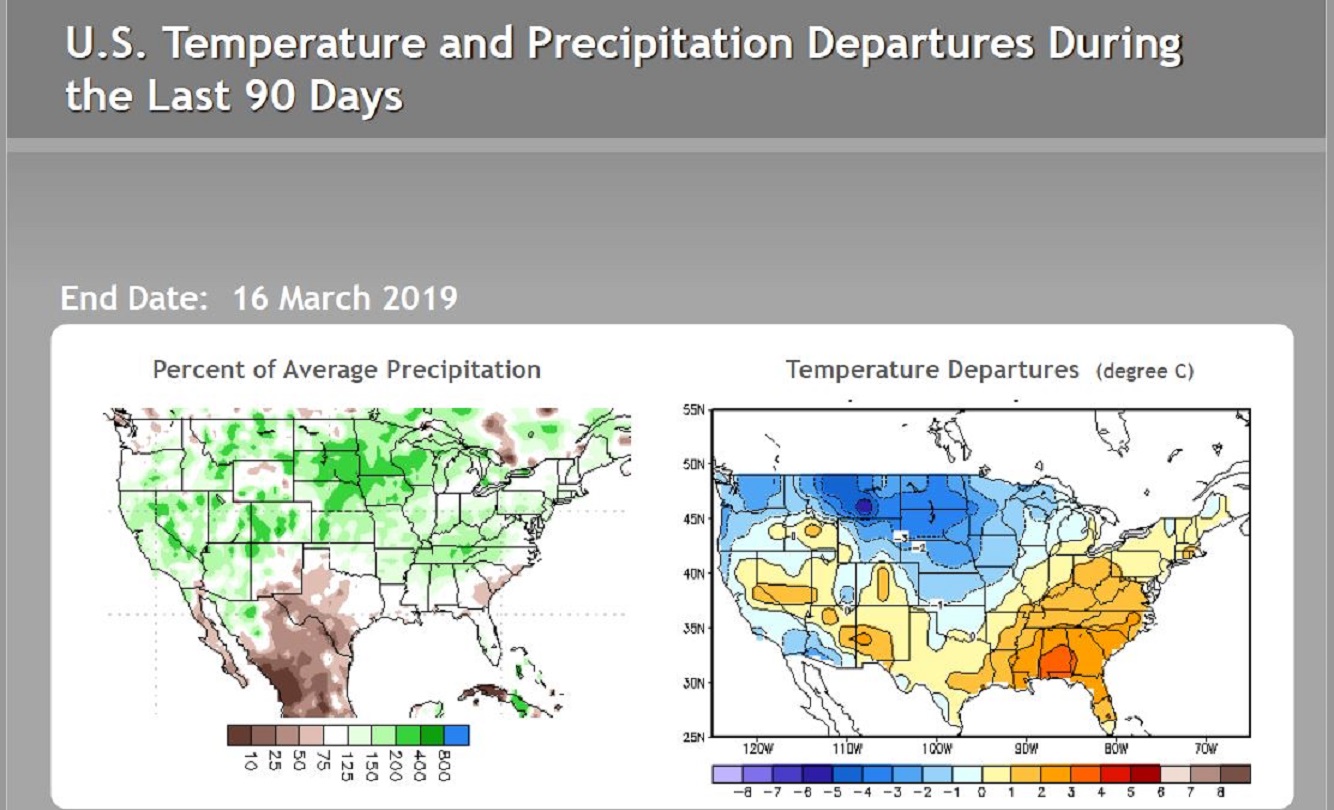
So, over 90 days or three months, three winter months, the already cold region received above normal precipitation frozen in place by a below normal Arctic chill that settled in with the visit from the Polar Vortex during the later days of the month of January. What followed was weeks of frigid February temperatures and additional pacific storms. Then, all of a sudden this mammoth early spring storm whips itself into a frenzy reaching unusual low barometric pressure for so early in the storm’s life cycle, or in other words the storm got really strong really quick. The west side became cold, wintry and white with hurricane gusts. The warmer east side surged northward on gusty winds. This drove above freezing temperatures well north over frozen, snow covered ground of Nebraska. Rain along with thunderstorms produced immediate runoff because of frozen ground. The storm attacked Nebraska with all weapons, both sides. Wintry and white on one side, mild and melting on the other.
The following tables are Monthly Climate Data for Norfolk, Nebraska for February and March. Norfolk was ground zero for the beginning of the dangerous flood. Direct your attention to the DEP ( Departure from normal) column #5, notice most of the month shows negative values, that means below normal temperatures. Now start at about February 15th and continue down until March 07th, you are looking at three solid weeks of double digits below normal departures. Notice during this stretch that there are no daytime highs above freezing. The snow depth at Norfolk is not overly impressive, but still up to 4 inches of snow depth a day and a half before the storm hit.
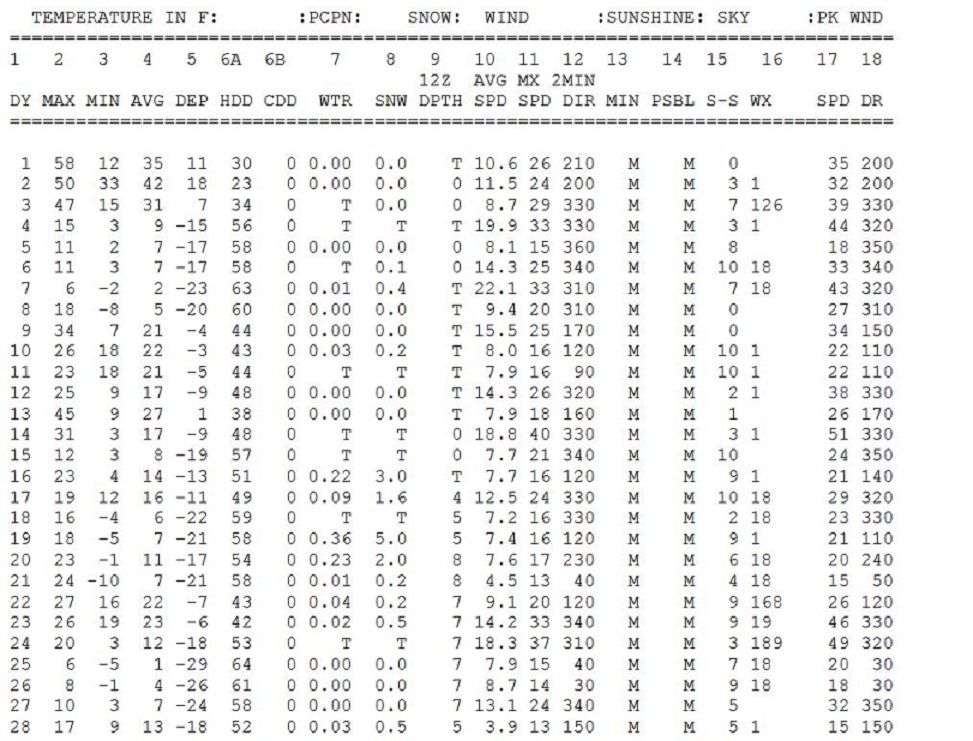
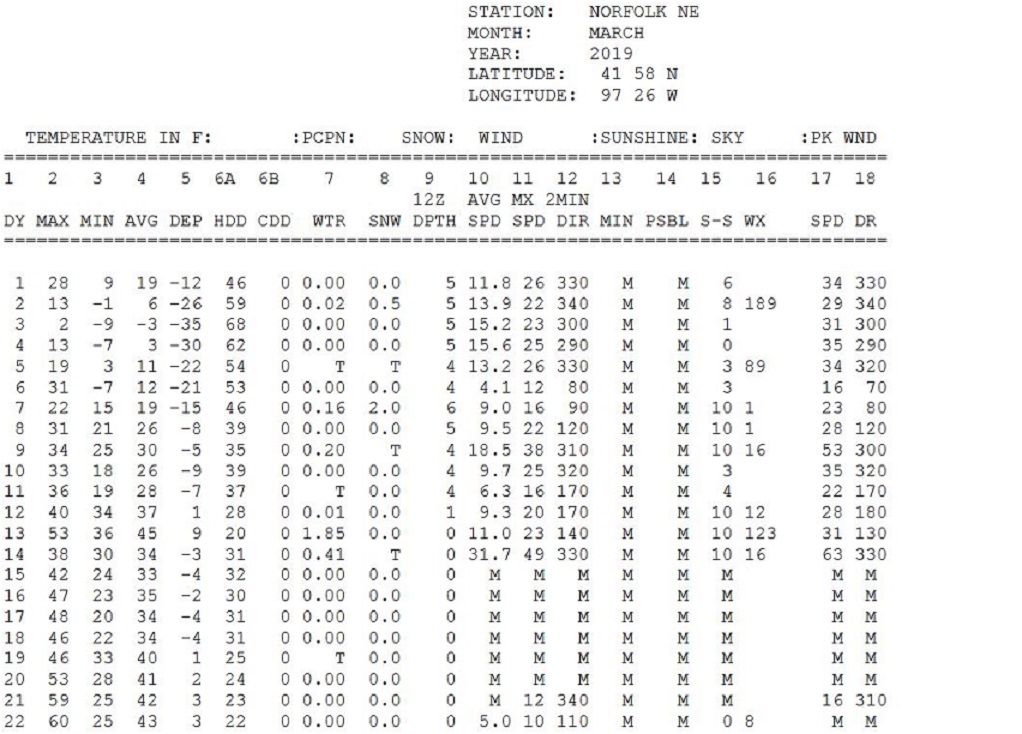
Then the epic storm dropped over two inches of rain in a matter of hours on top of that snow cover and frozen ground. The day of the storm the high temperature reached 53, or 21 degrees above freezing. This would be the first day this mild since February 1st, a six week stretch.
A look at the storm evolution using a four panel presentation. The top row, surface map and snapshot satellite picture, followed by 700 and 500mb flow for times indicated.
March 13, 2019 00z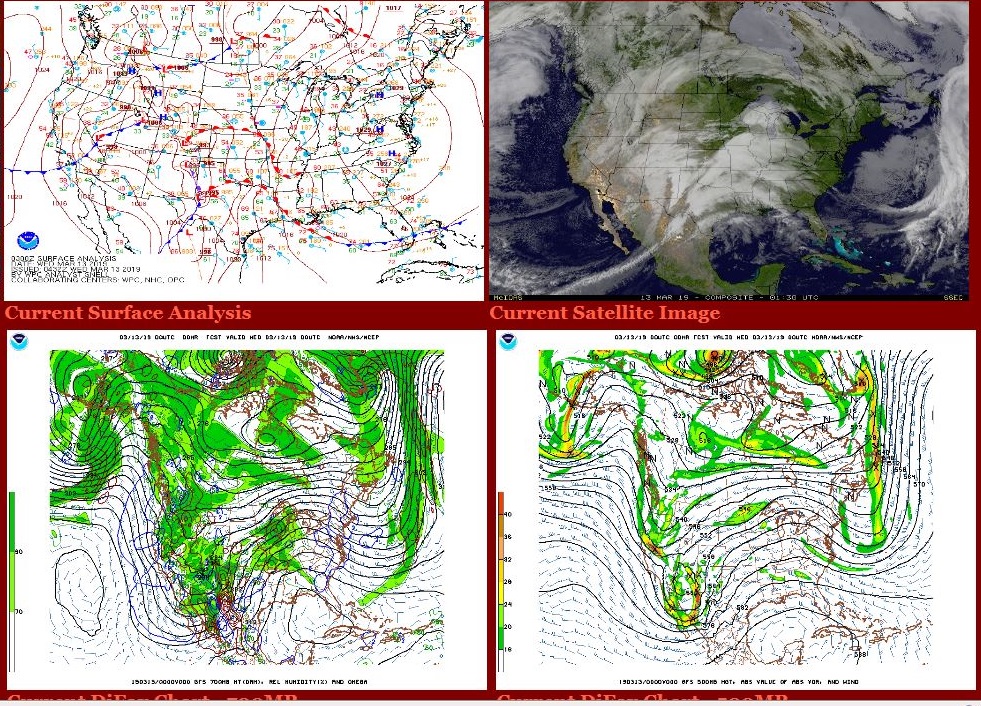
March 13, 2019 12z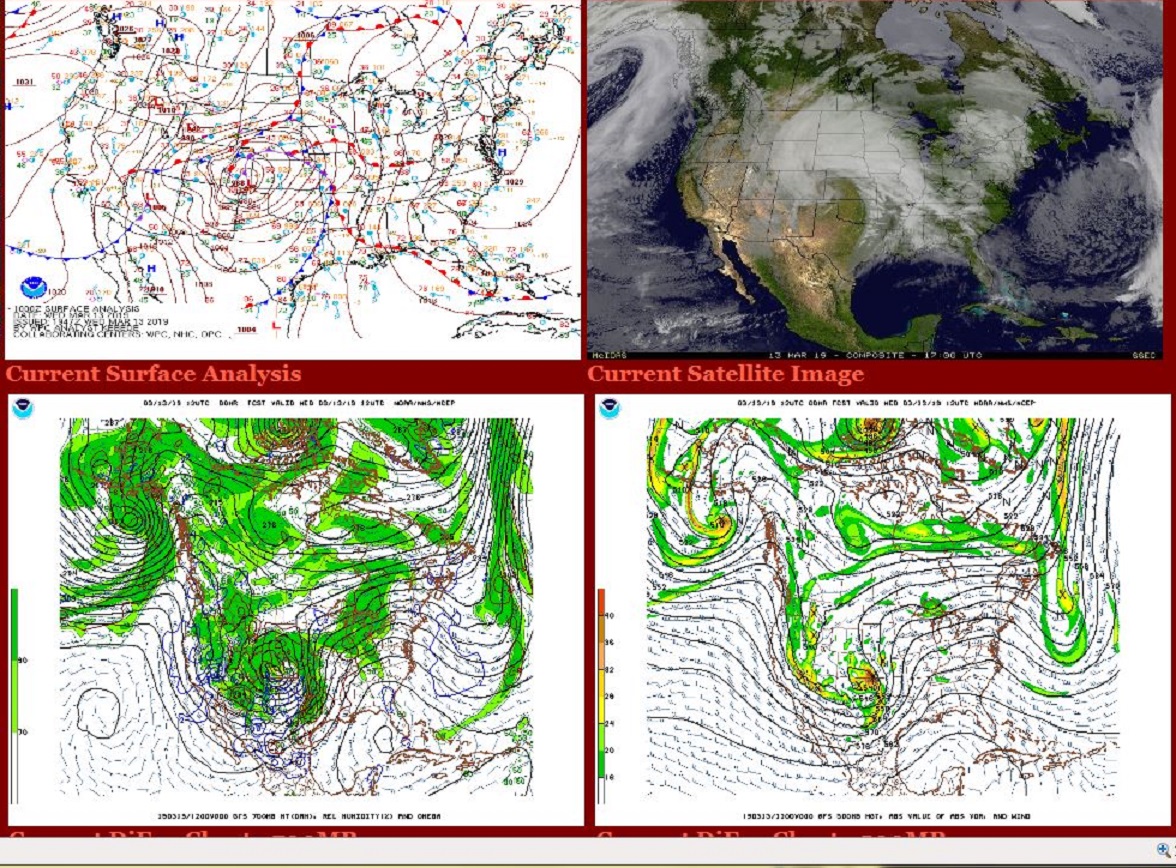
March 14, 2019 12z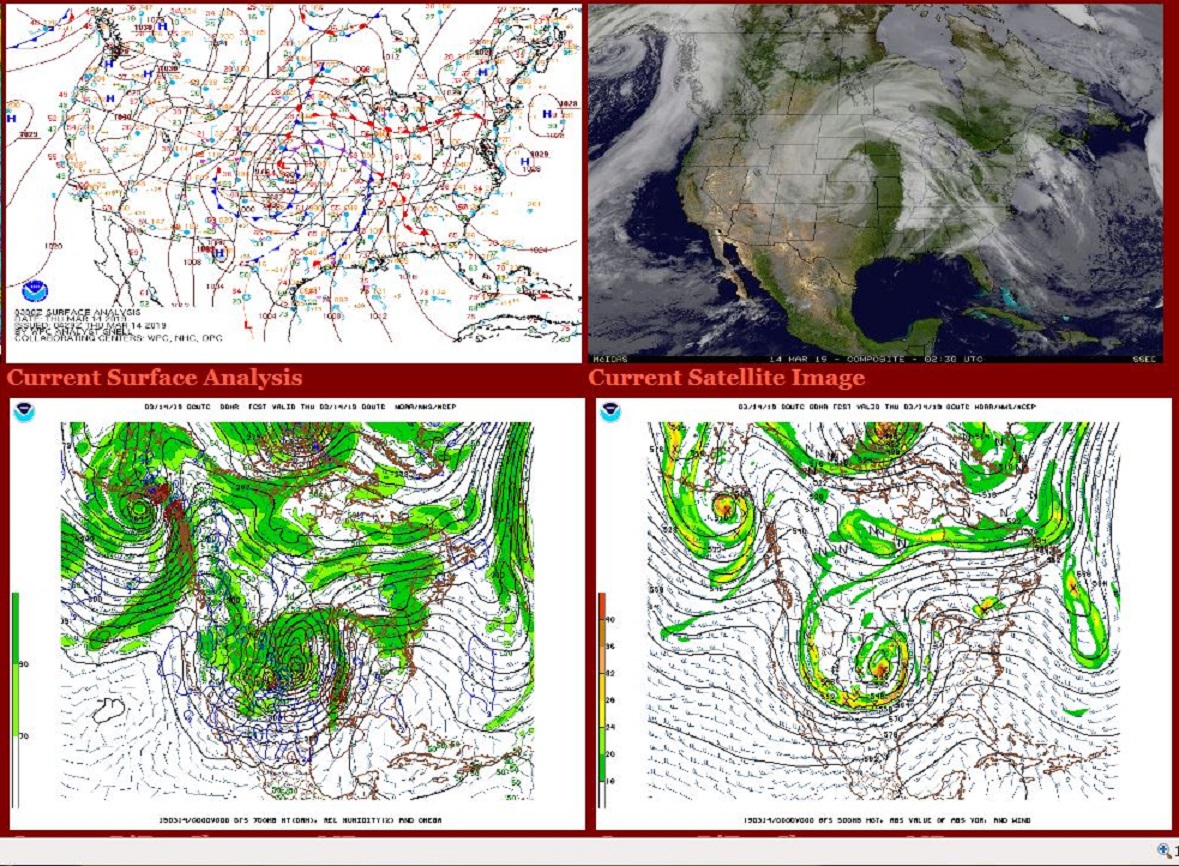
March 14, 2019 12z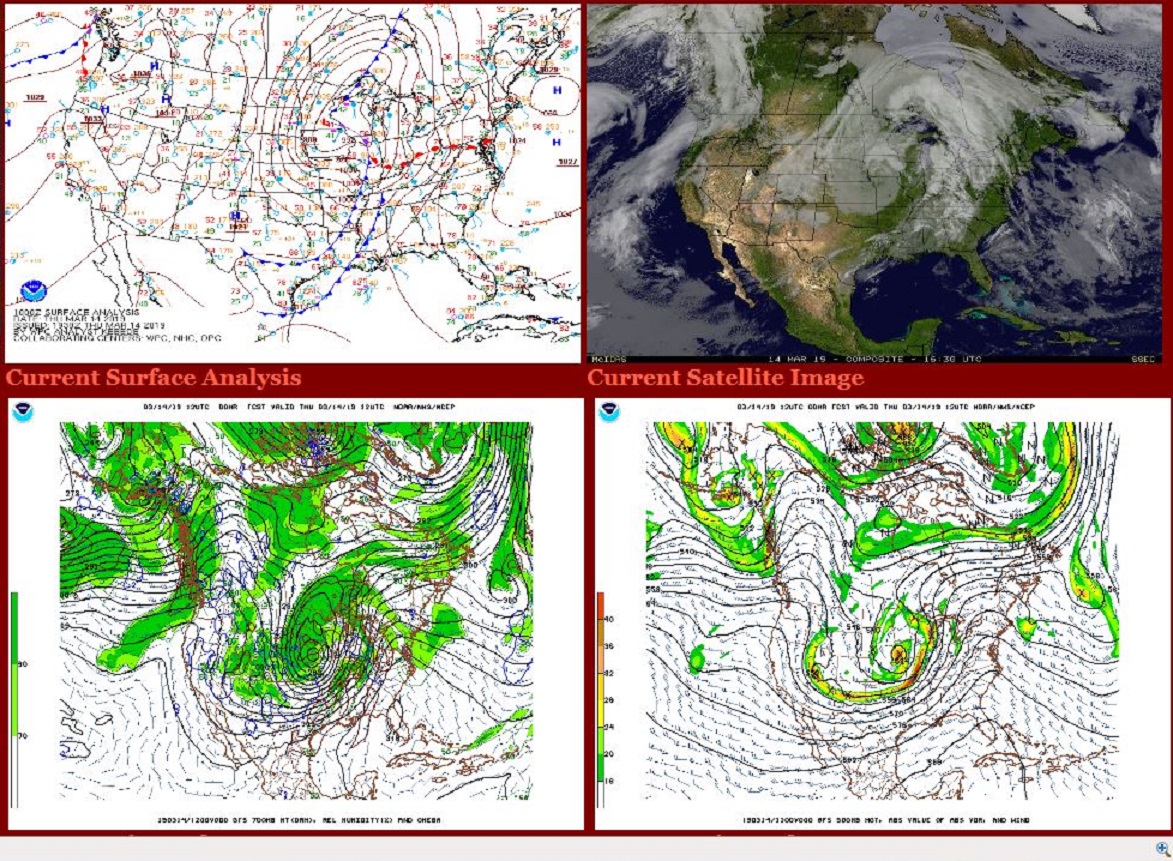
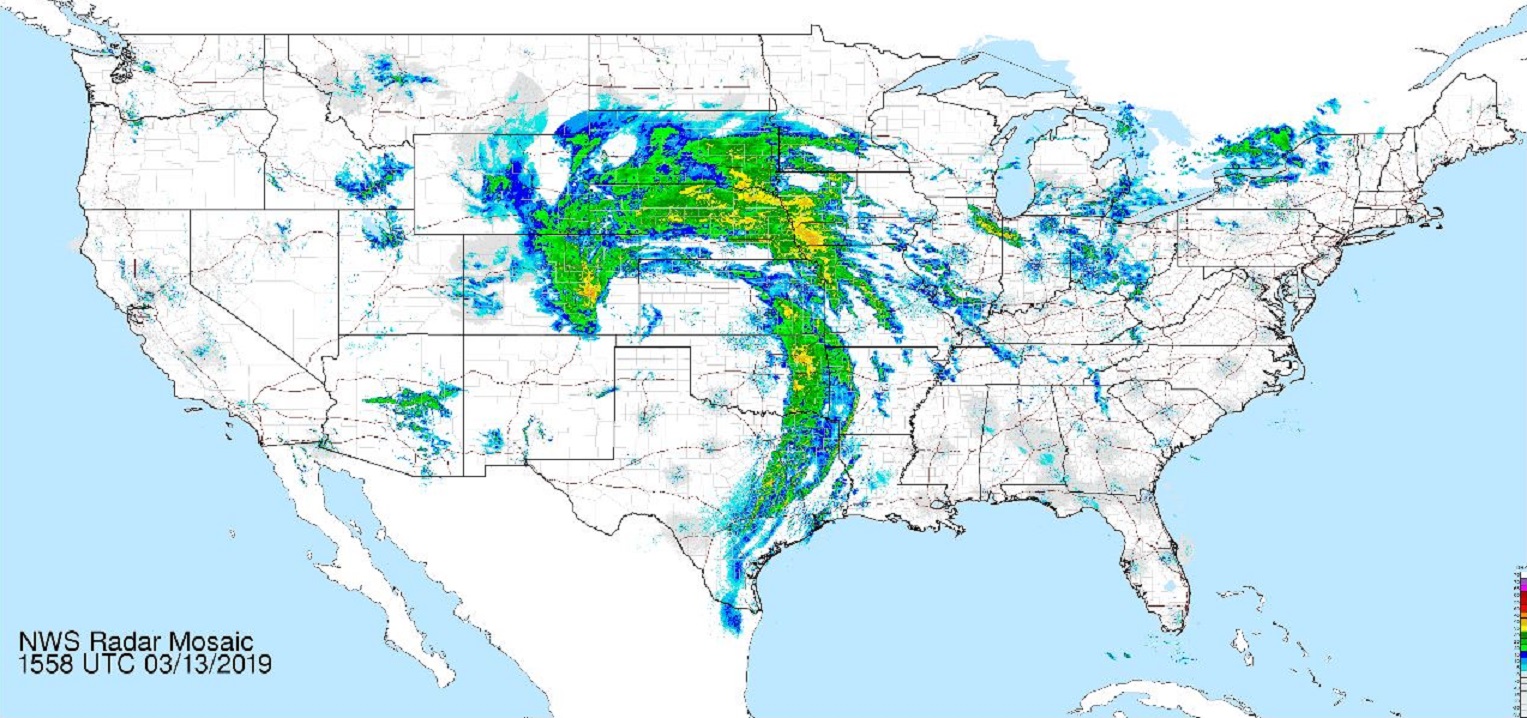
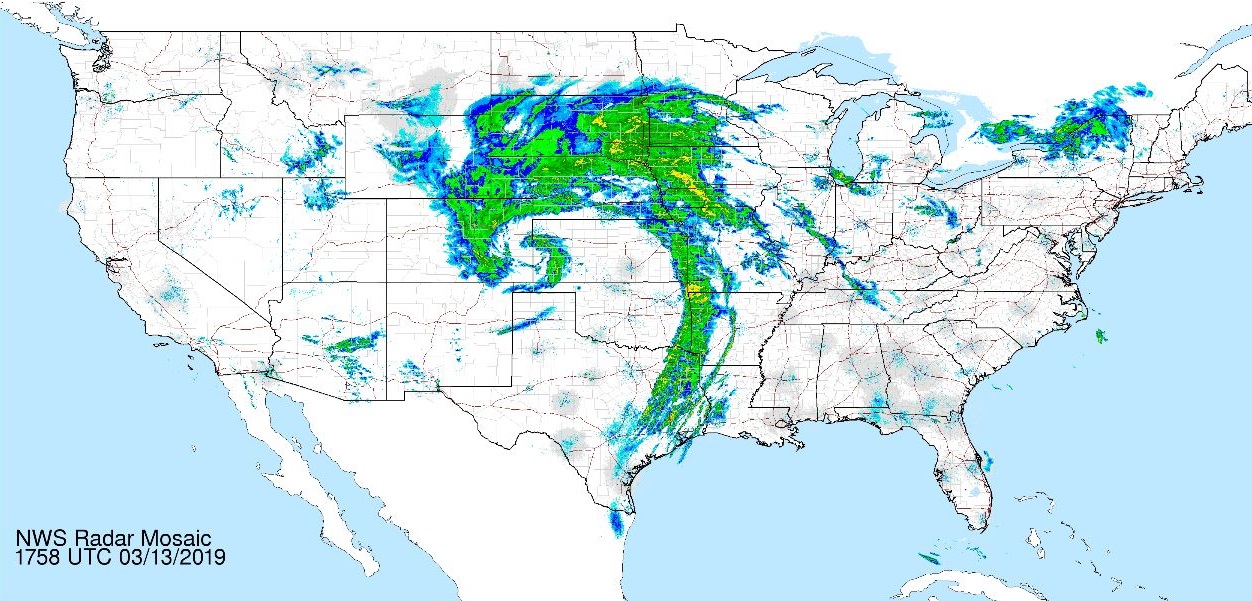
Below two glimpses of the National radar summary during the day on March 13th, note that Nebraska is covered by radar echoes. Eastern Nebraska received rain, the western counties of the state saw the snow with gale force winds and whiteout blizzard conditions.
Finally, the recently issued outlook for Spring flooding from NOAA’s River Forecast Center, shows more problems ahead. Snow melt with warmer temperatures and any rain on still frozen ground could still bring flooding to the Northern Plain, the Mississippi Valley and parts of New England.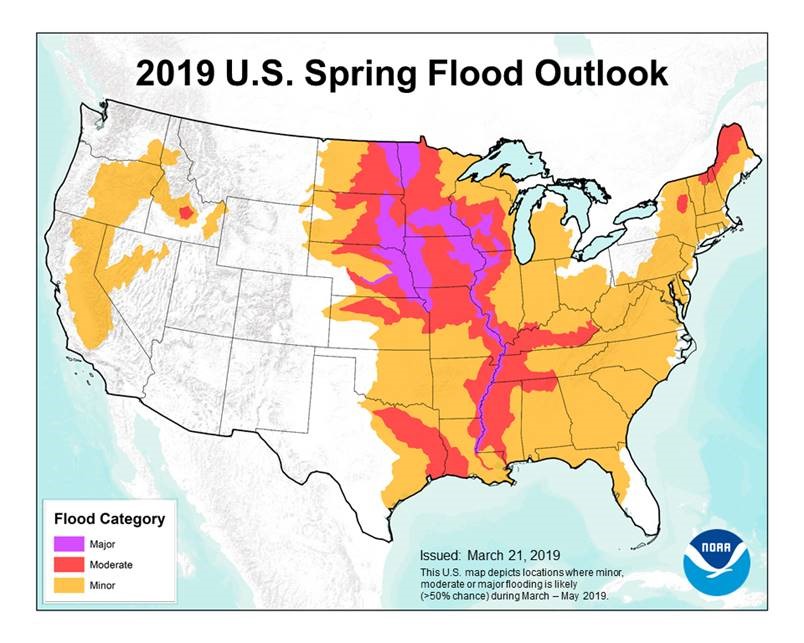
Another opportunity for seasonal flooding may be just weeks away when the warmer temperatures of spring reach the deep snow pack of the mountainous West. The Rockies, parts of he Cascades, and the Sierra have all received above normal precipitation. Below, snow depth this passed Friday in Sequoia National Park.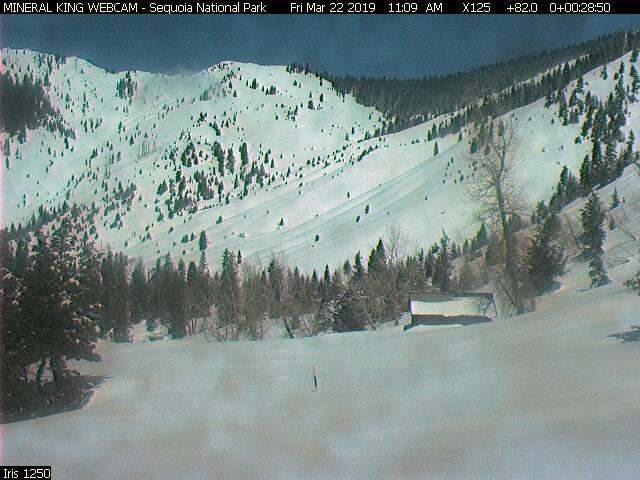
Same picture, nearly same time last year.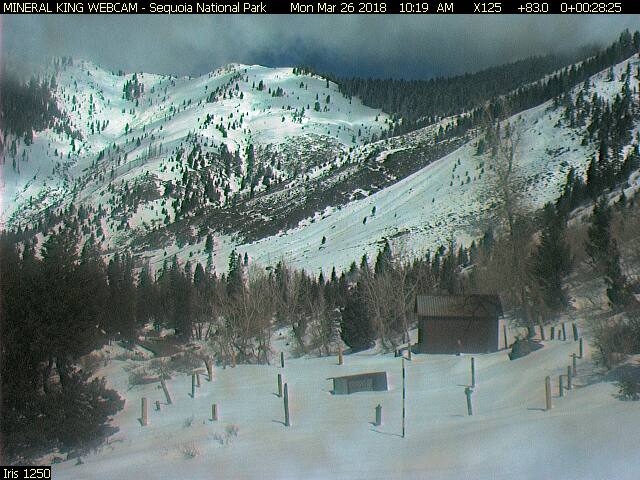
Website to follow Mineral King webcam: http://www.mk-webcam.net/
Keep an eye on our active weather pattern, more surprises may be just days away.
Other websites that helped in the creation of this blog entry:
https://www.cpc.ncep.noaa.gov/ Climate Prediction Center
https://www.weather.gov/oax/ https://w2.weather.gov/climate/index.php?wfo=oax National Weather Service Omaha
https://www.weather.gov/Radar National Radar
https://www.wpc.ncep.noaa.gov/archives/web_pages/sfc/sfc_archive.php Weather Prediction Center
https://www.ssec.wisc.edu/data/us_comp/small Space Science and Engineering CenterUniversity of Wisconsin-Madison
https://mag.ncep.noaa.gov/ https://mag.ncep.noaa.gov/model-guidance-model-area.php Model Analyses and Guidance
That all for now,
Wild Bill
PS … A short 4 years ago Nebraska was experiencing record warm temperatures in the middle of March 2015. Just an example of the variability of weather from year to year.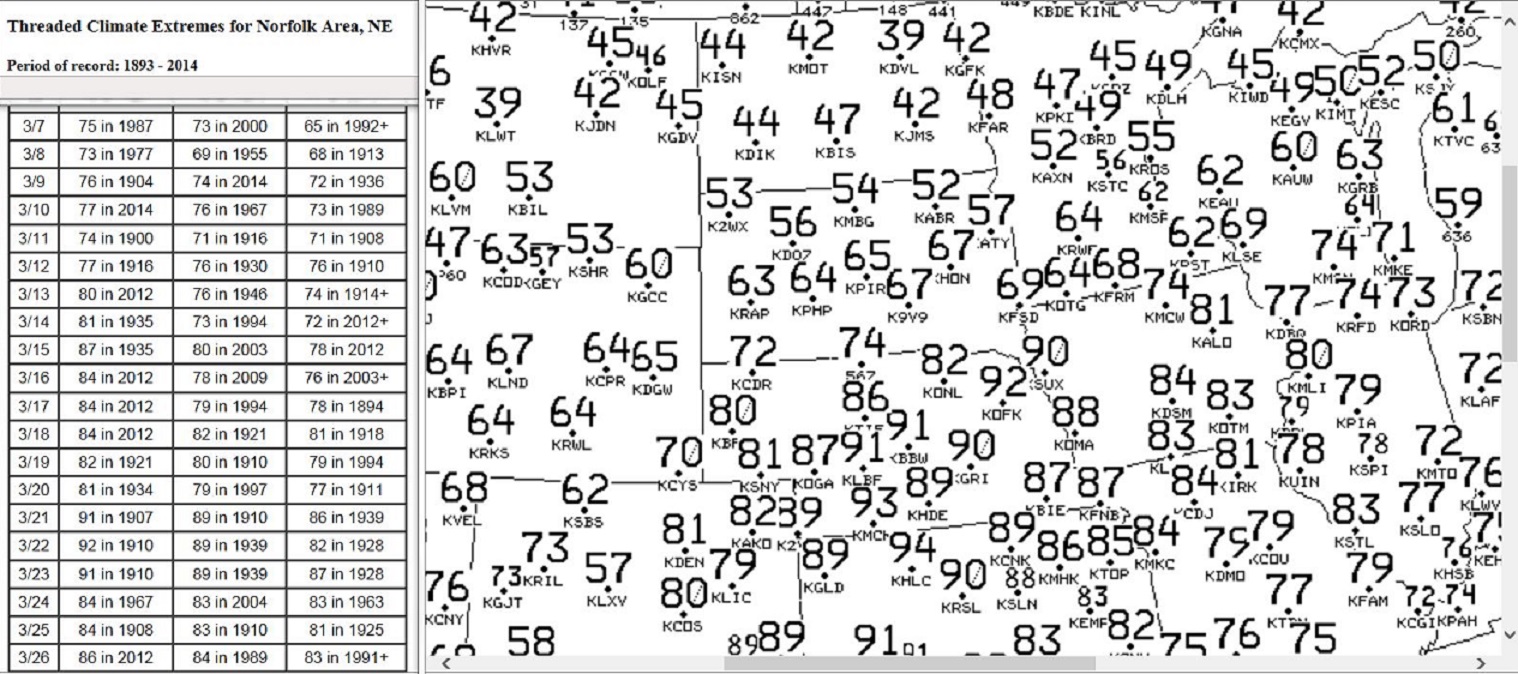
The graphic shows a record high of 92 degrees at the Norfolk(KOFK) location on March 16, 2015. This broke the daily record by 8 degrees and also became Norfolk’s earliest 90 degree reading of the season.
OK, now I am done.