October 31, 2015
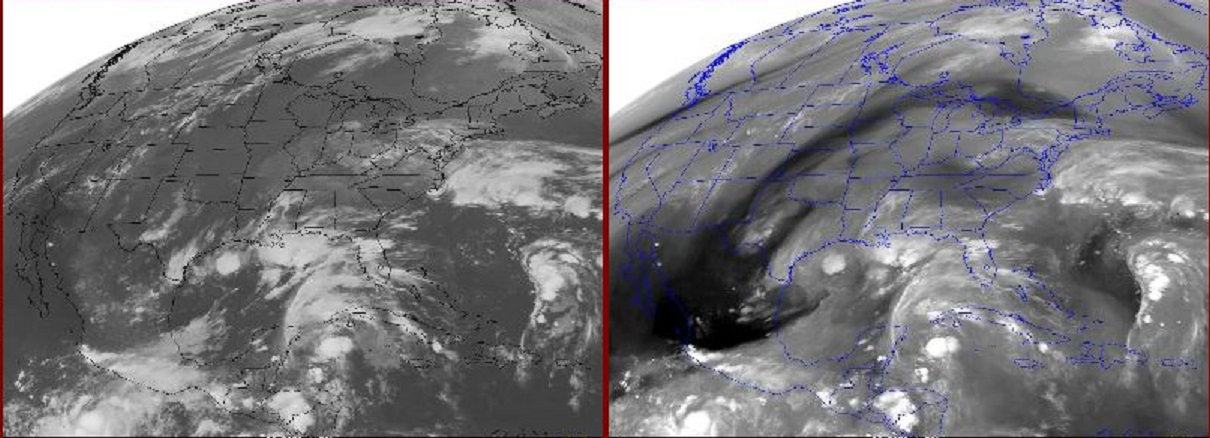
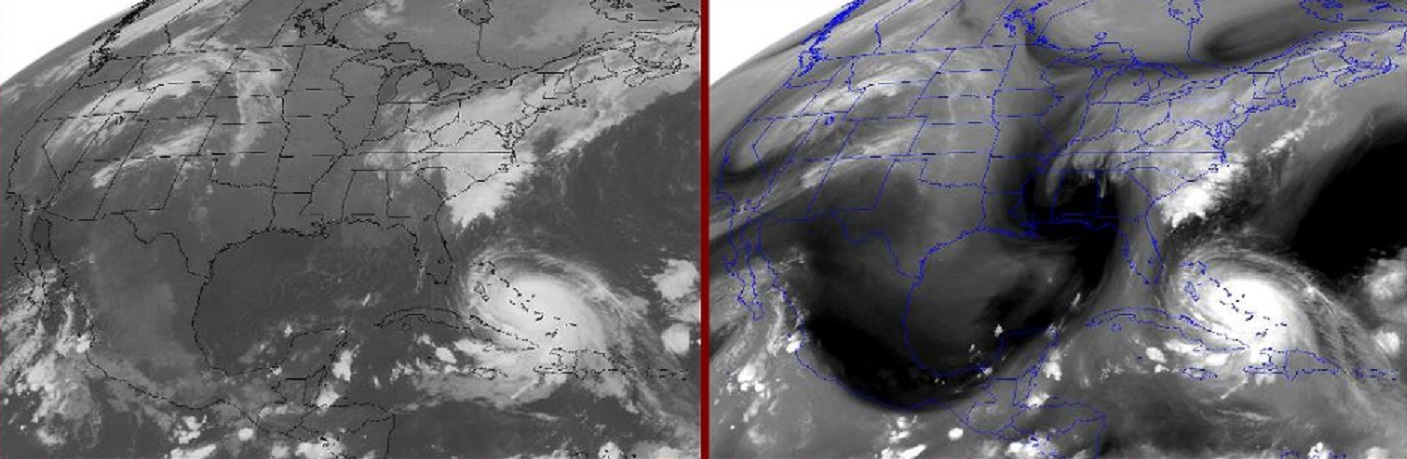
Same Texas rivers, same Texas towns, inches of rain, as extreme flash floods try to erase years of drought. Months apart, and on the opposite sides of summer, yet even in this simple comparison, the similarities are unmistakable. If it wasn’t for the small differences in the satellite picture you might think I repeated the same maps.
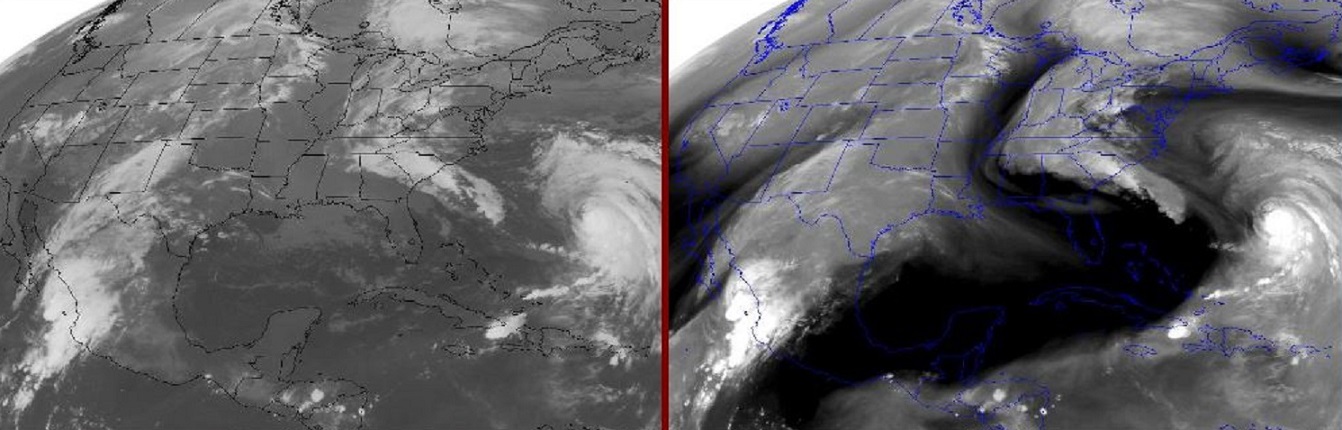
Briefly, on both surface maps, a warm front over north Texas, a surface high pressure area centered near West Virginia. On the upper charts, the event driving upper low over southwest centered near the four corners, a warm ridge over Florida, and some other vortex up over New England.
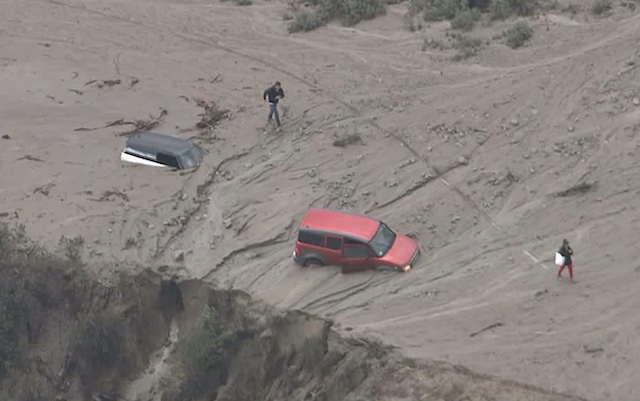
May 23, 2015 Overnight flash floods on the Blanco River Texas claim several lives.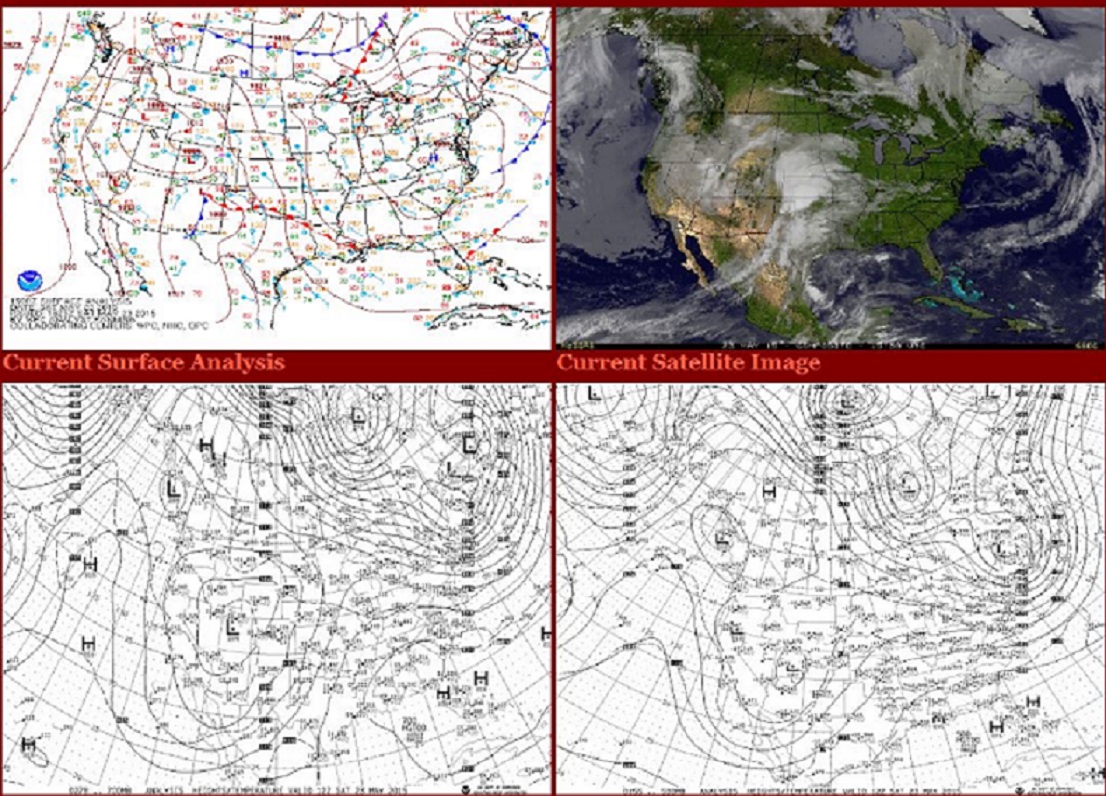
October 30, 2015 Flash floods return not only to Central Texas, but to the same river basins as the May flash flood. 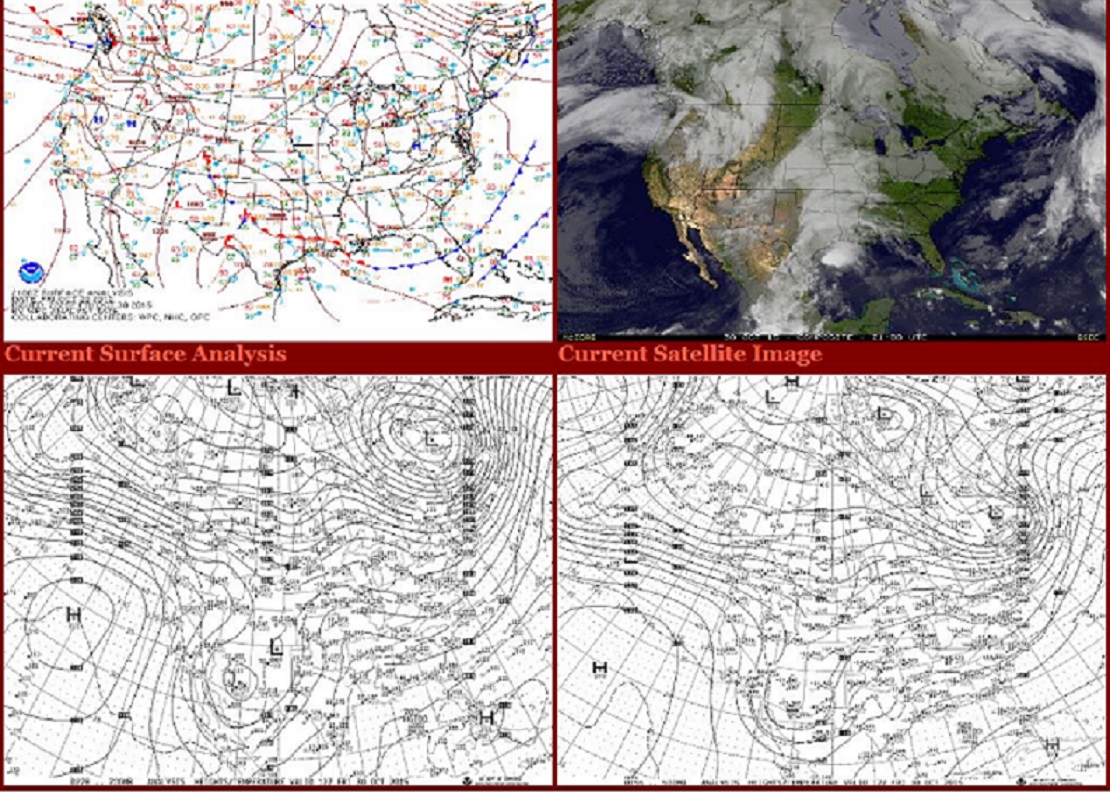
from this blog October 22, 2015:
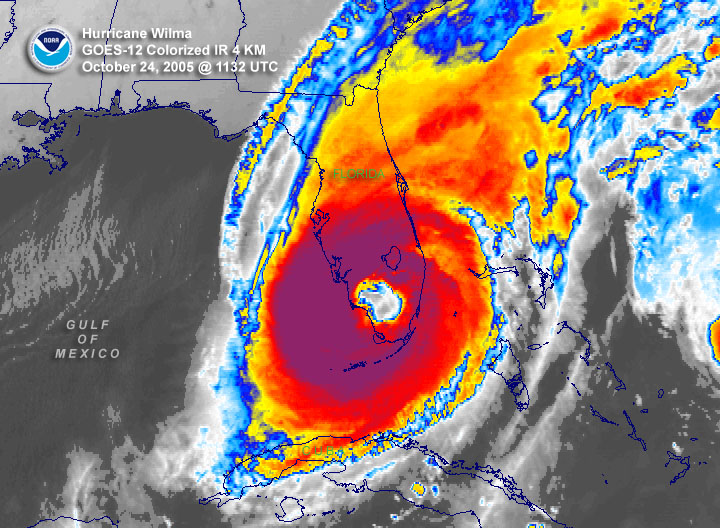
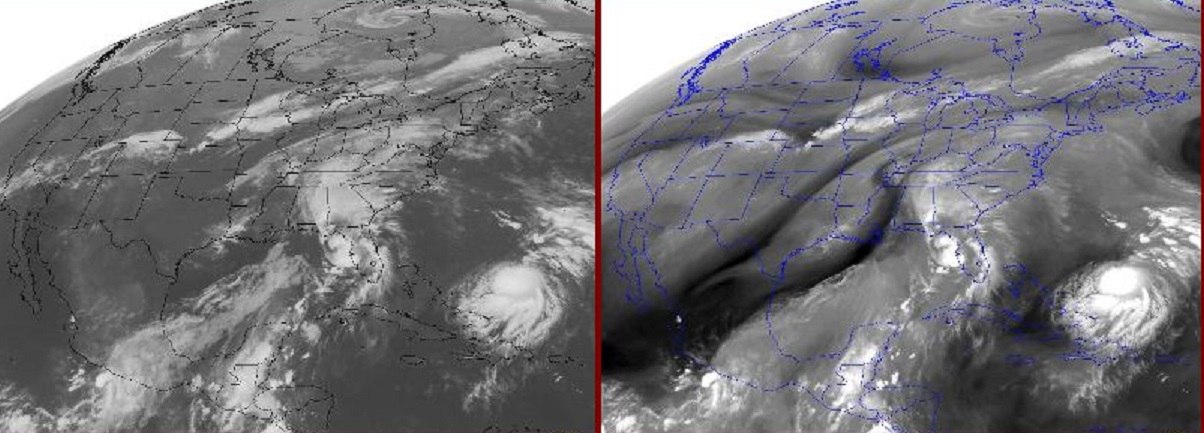
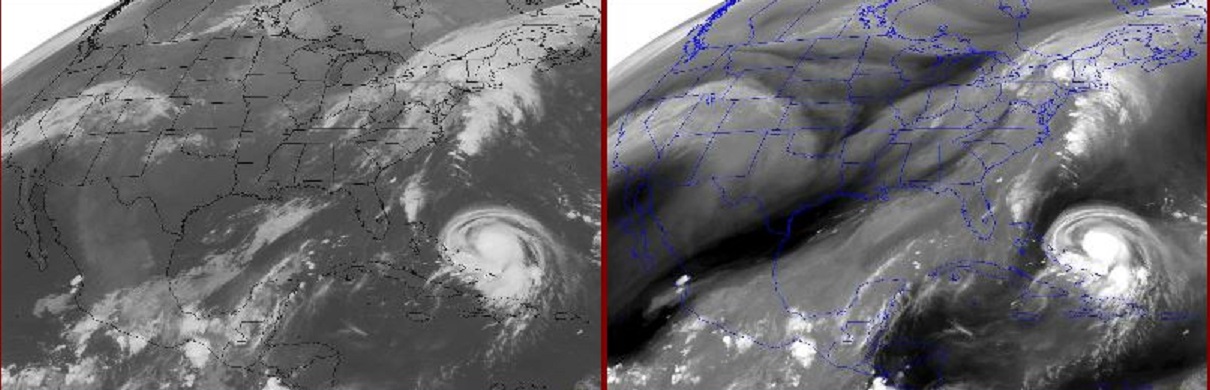
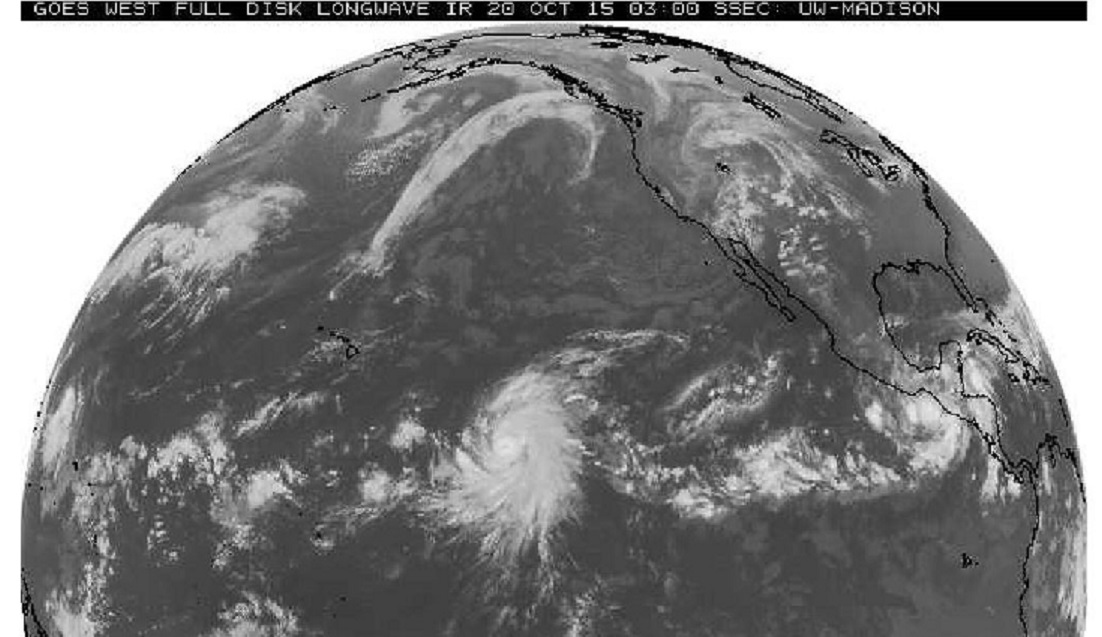
“Olaf and now Patricia are currently hurricanes in the Pacific. Both of these tropical systems may have some influence on the U.S. The above example shows how a direct hit is not necessary to inflict great damage.”
Patricia’s influence on Texas flooding a week ago was pretty obvious, Olaf’s contribution this week is a little more convoluted. But if you trace the disturbance back a few days, it is related to the decay of Olaf’s tropical circulation.
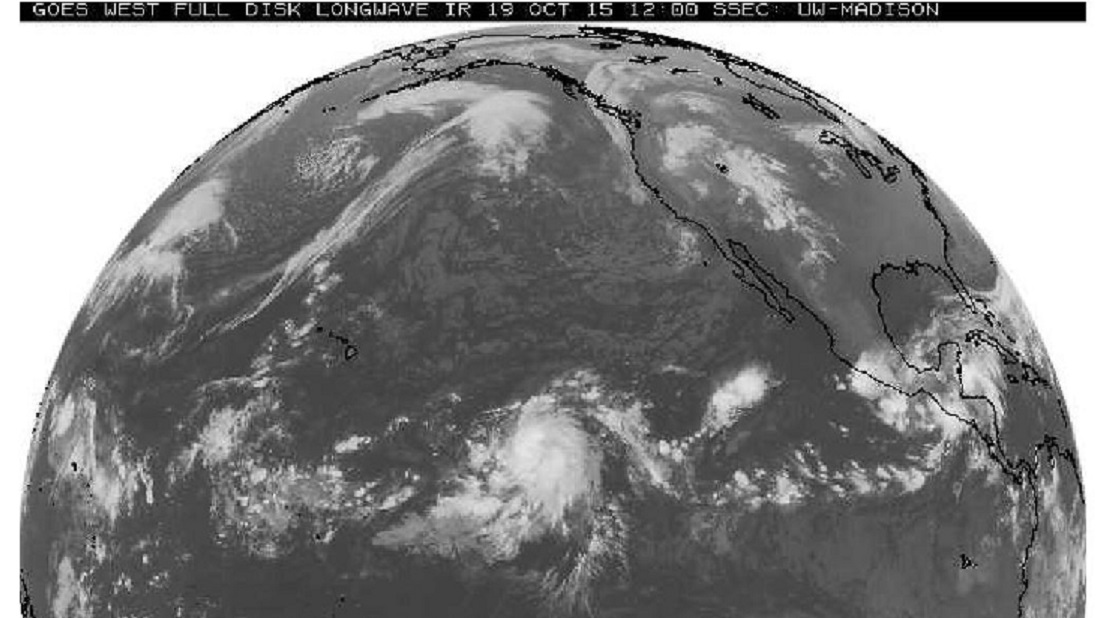
Below shows Patricia coming across Mexico, Olaf east of Hawaii, about one week ago.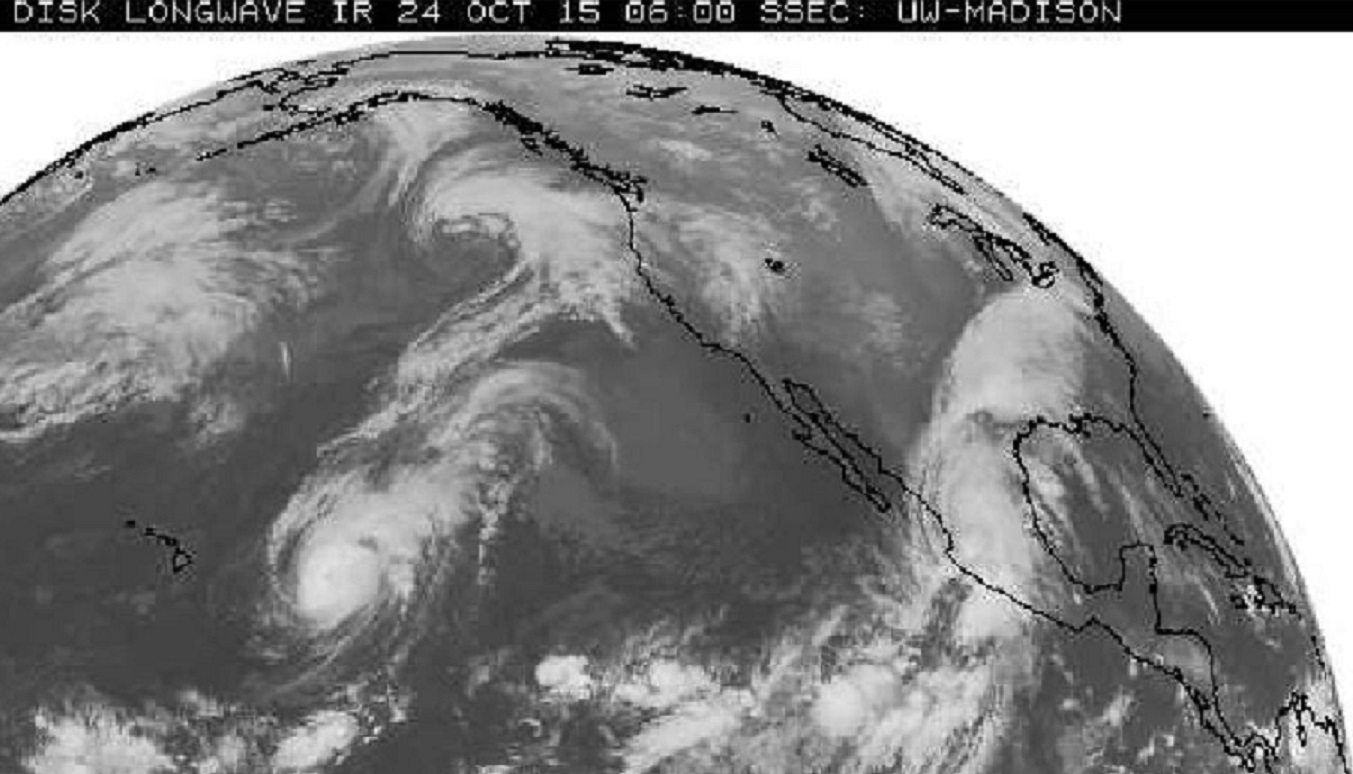
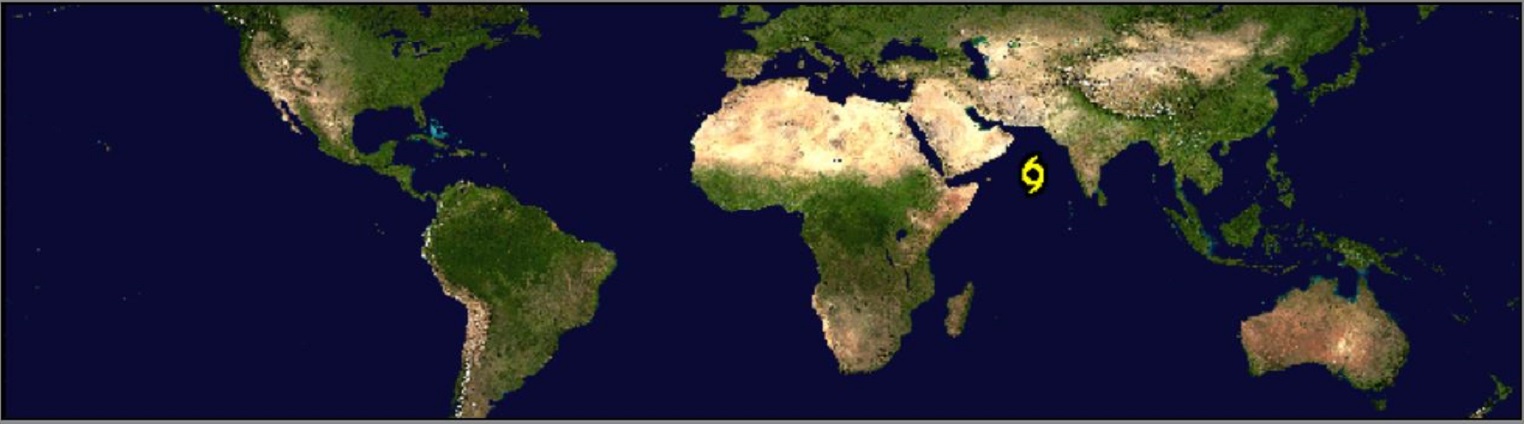
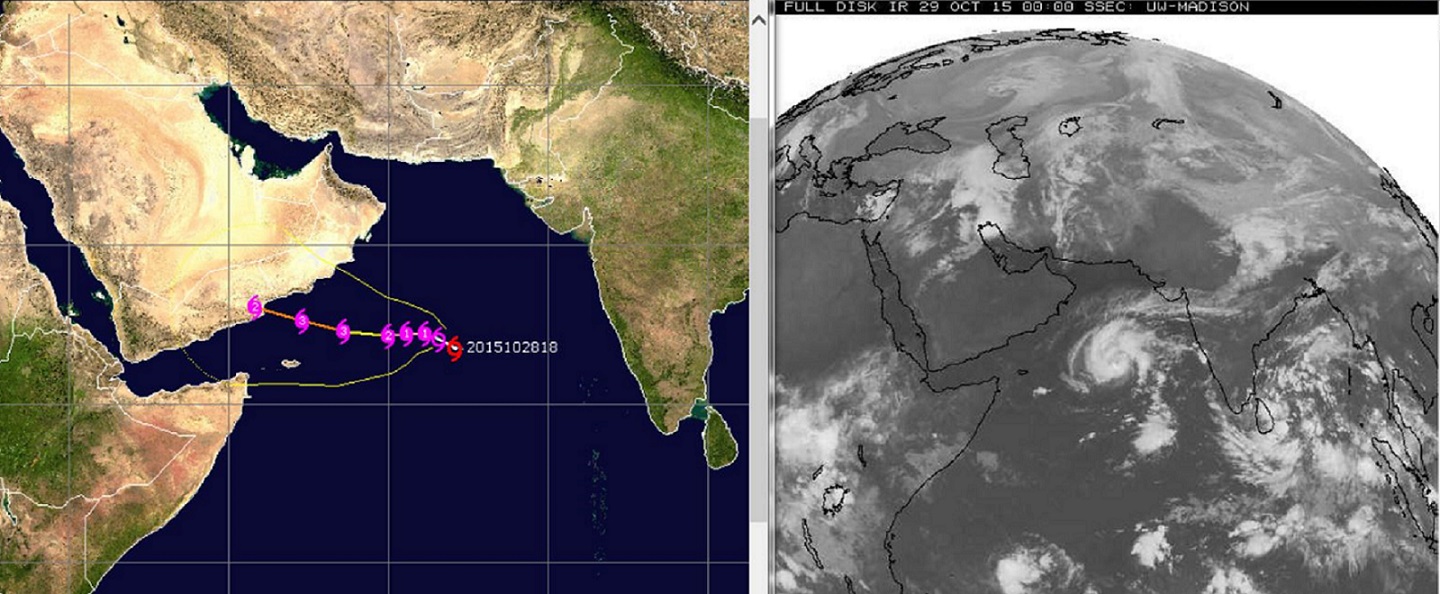
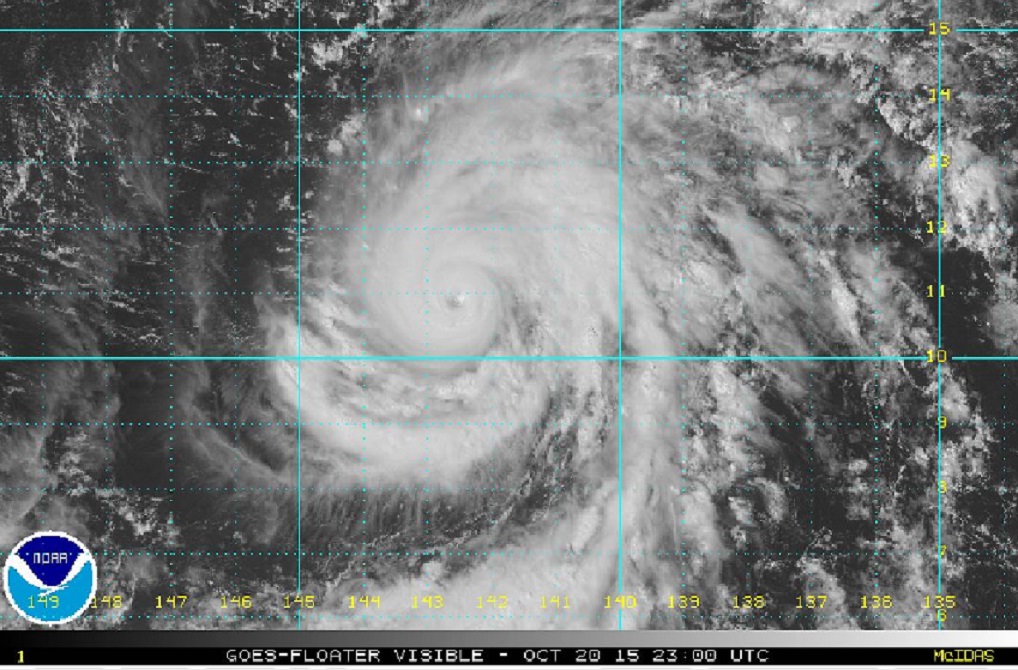
Not related, and on the other side of the world, but since I brought it up in the last blog here is an update on the one tropical systems going currently.
Category 4, 140mph, Cyclone Chapala in the Arabian sea on October 30, 2015.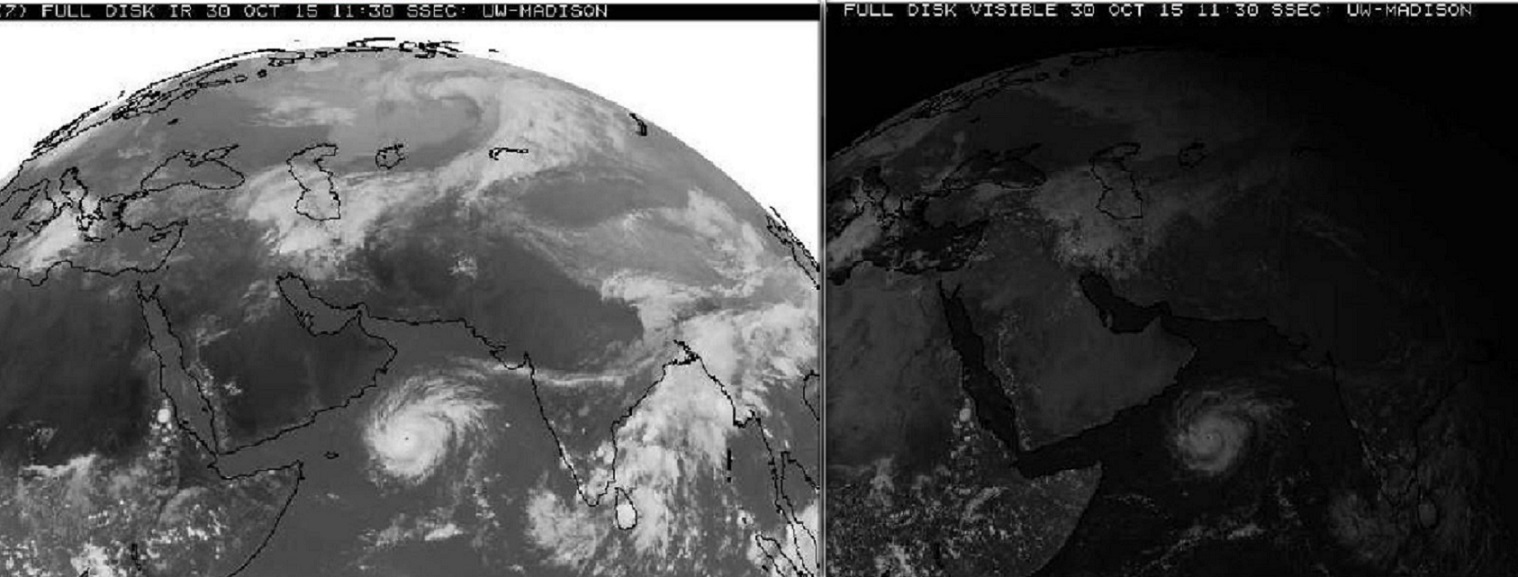
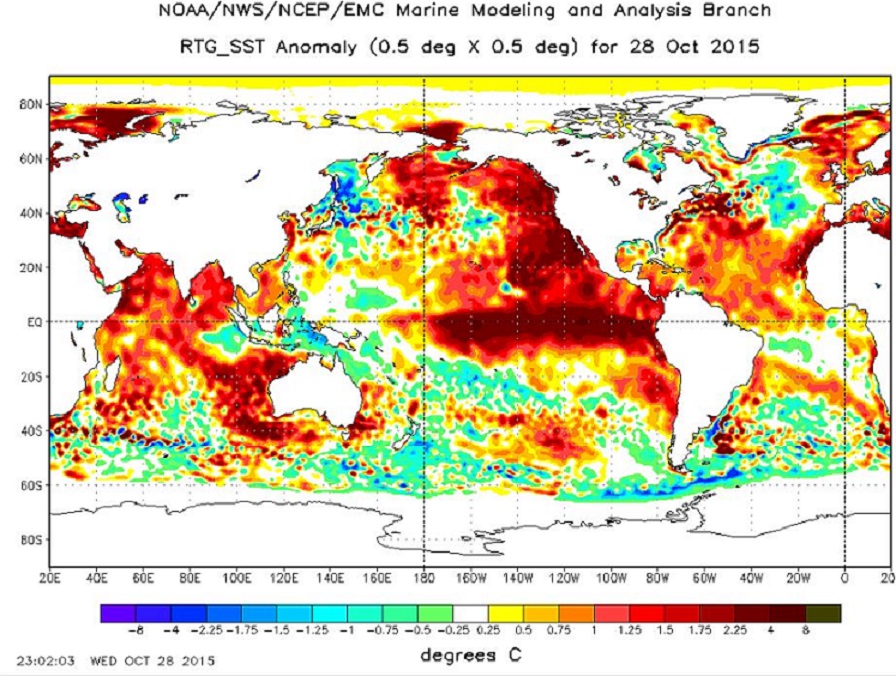
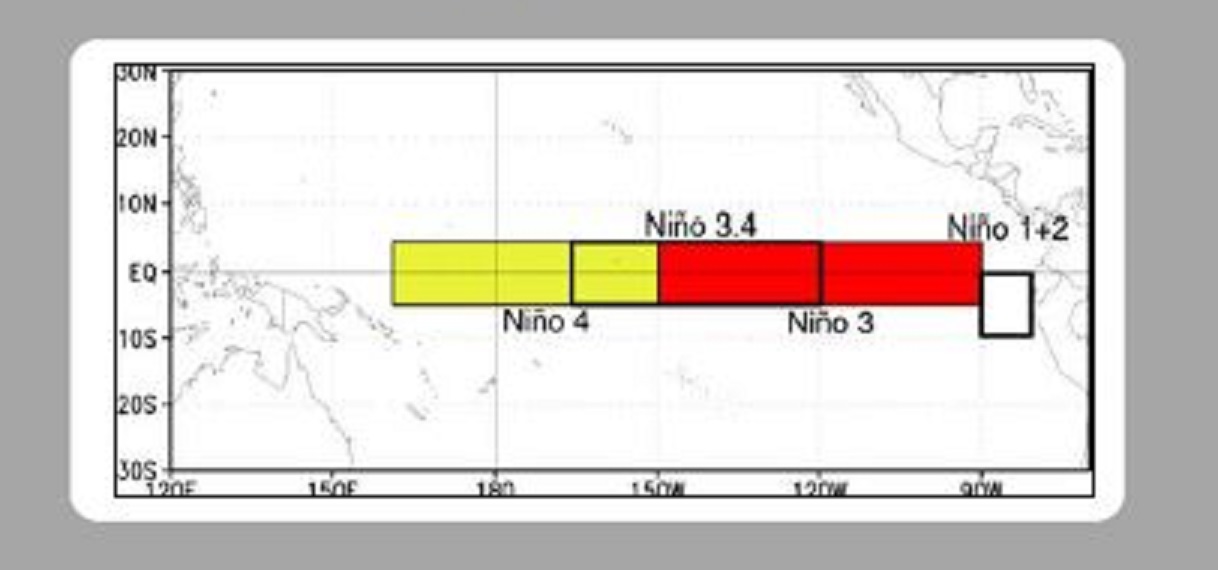
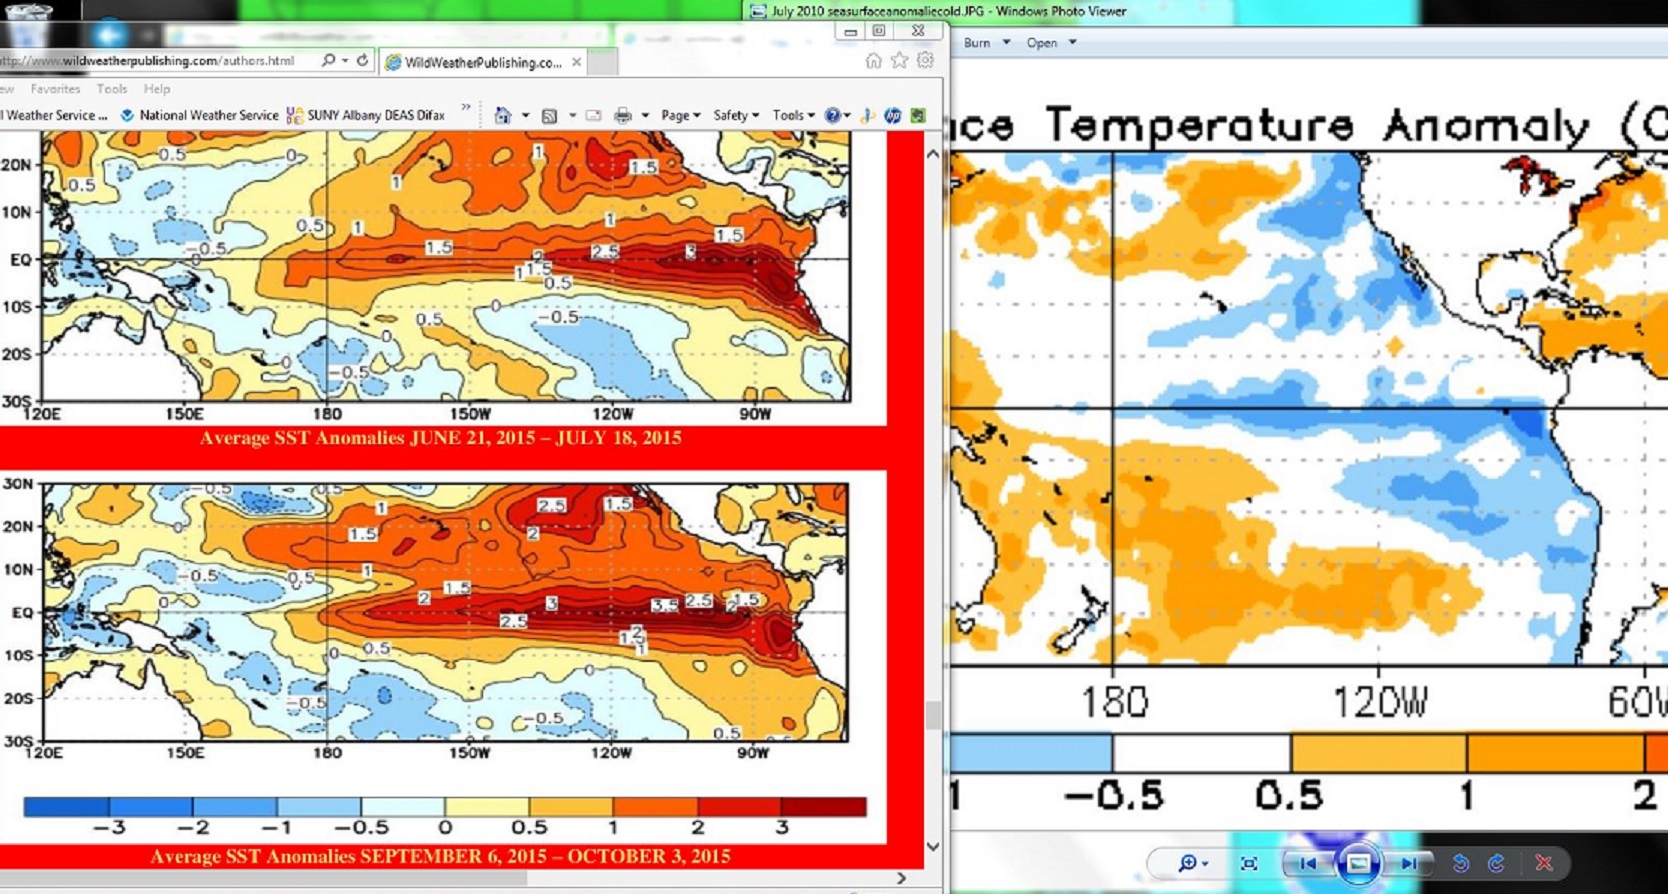
There is something going on somewhere everyday and El Niño is making it crazier as time goes by.
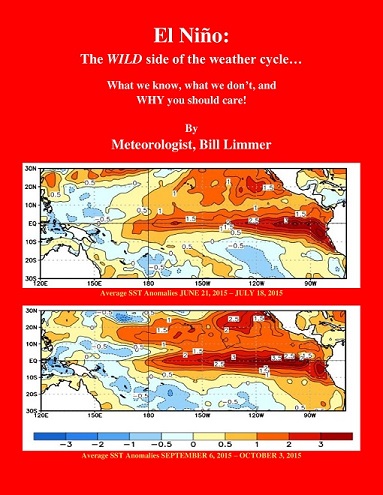
Learn more in my latest e-book El Niño: The WILD side of the weather cycle…
What we know, what we don’t, and WHY you should care!
I show how this years Pacific water temperatures compare to the 1982 and 1997 events and highlight the kind of weather episodes that the stronger El Niño’s tend to bring.
If you like the blog you will love the book.
Wild Bill