October 11, 2015
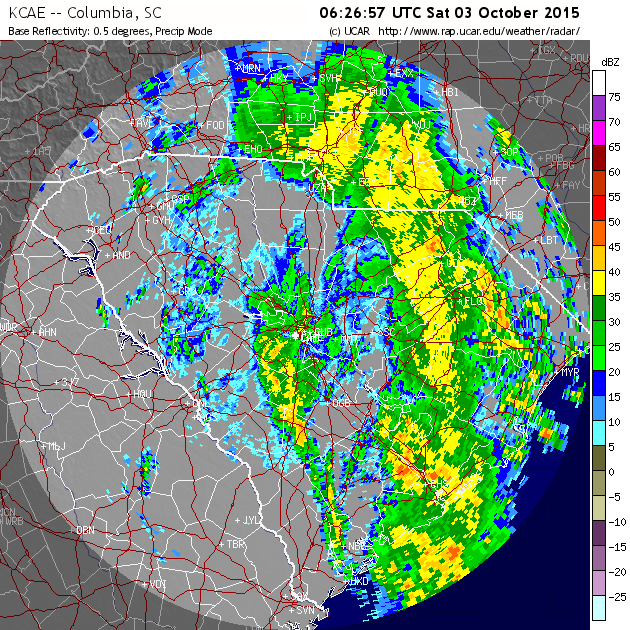
South Carolina rainfall update,
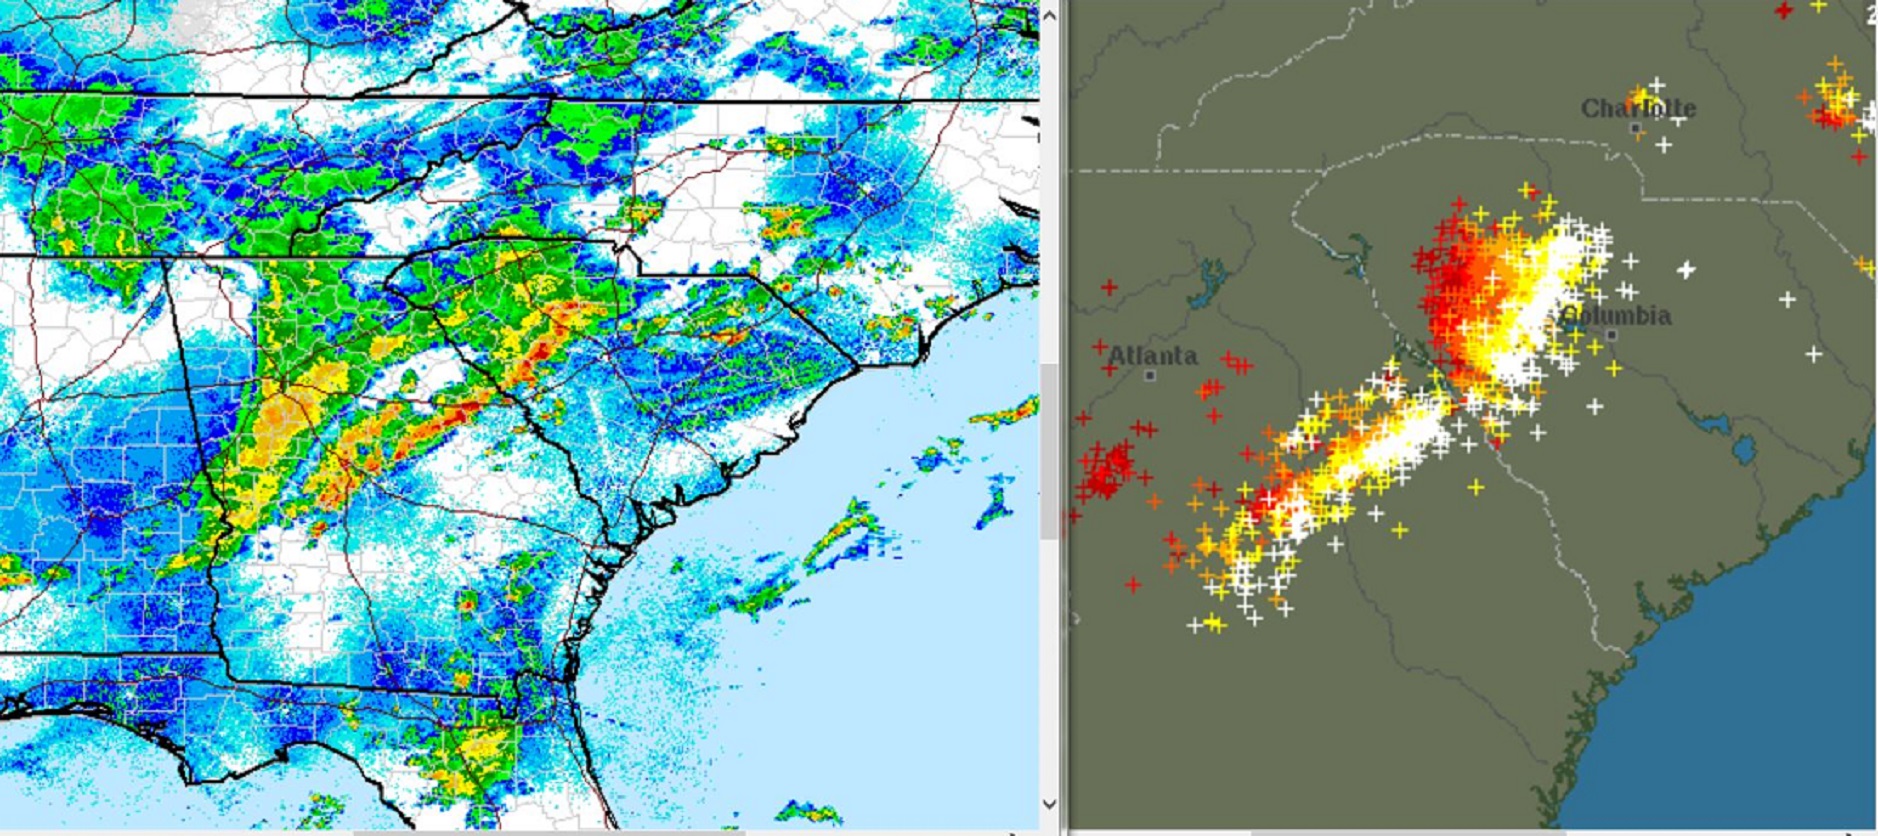
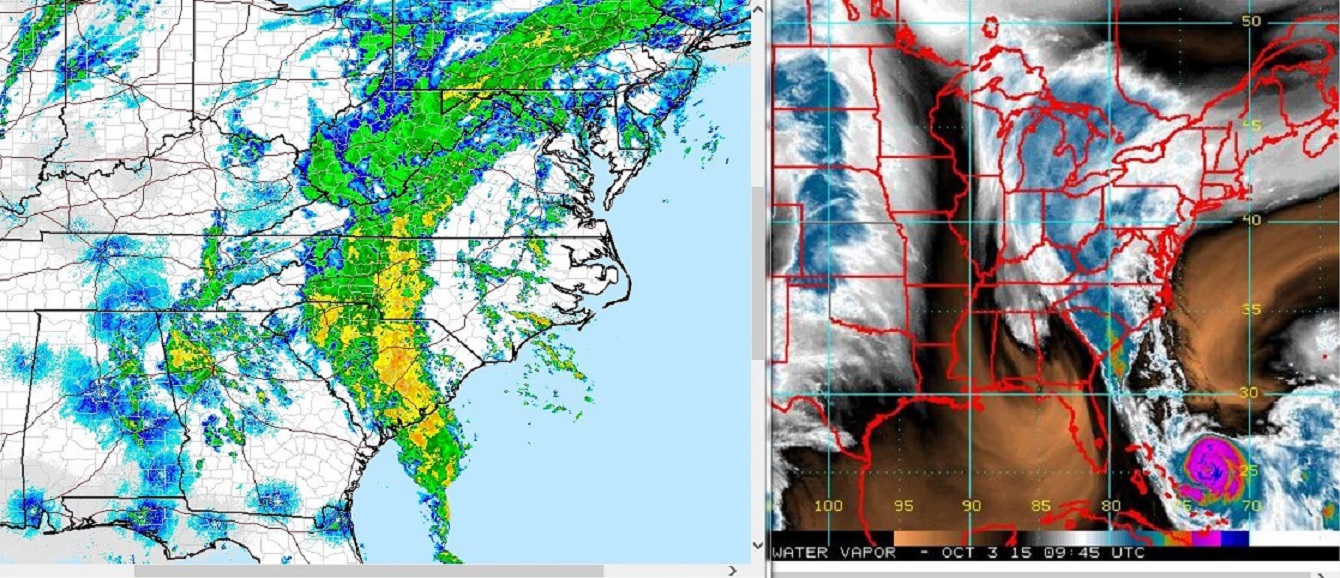
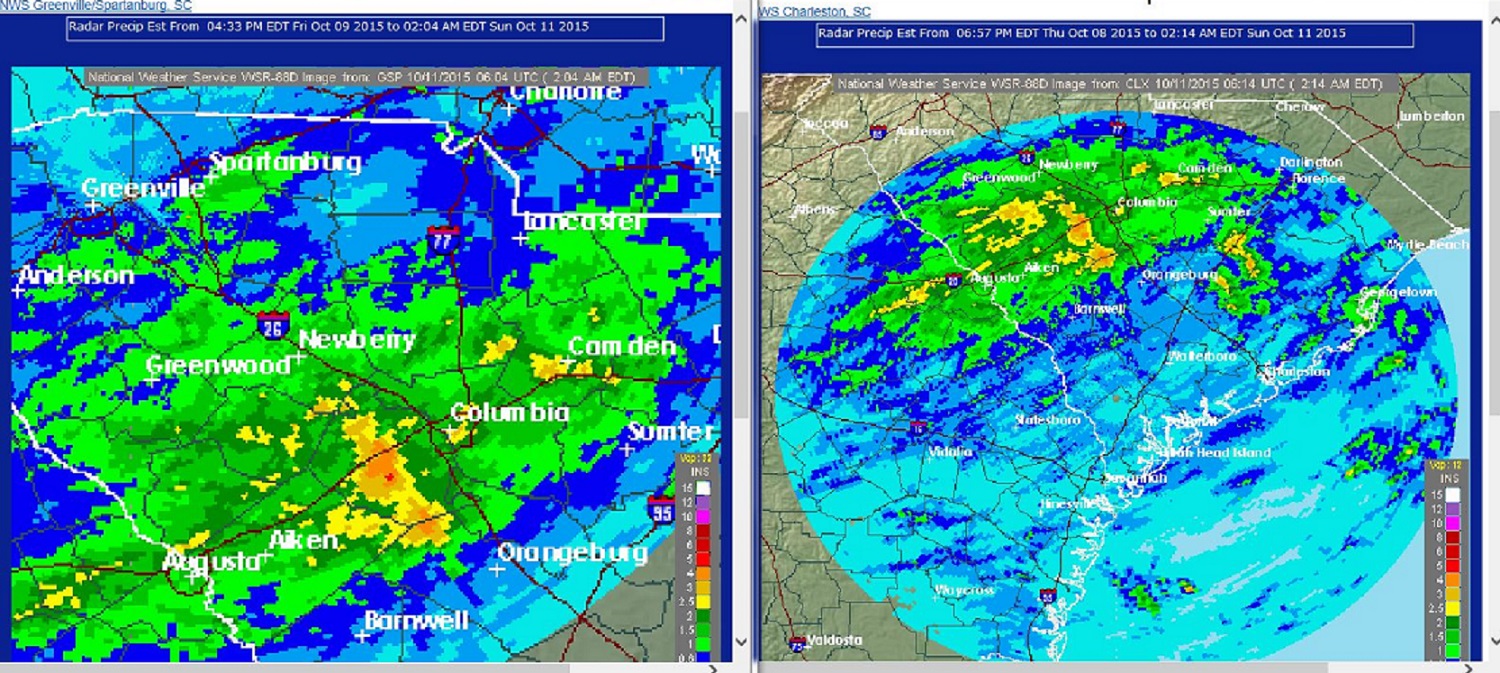
South Carolina rainfall on Saturday October 10, 2015. Radar estimates reach over 4 inches in areas west of Columbia. Several Flash Flood Warnings were issued less than a week after last weekend’s catastrophic event.
Forecast model inconsistence,
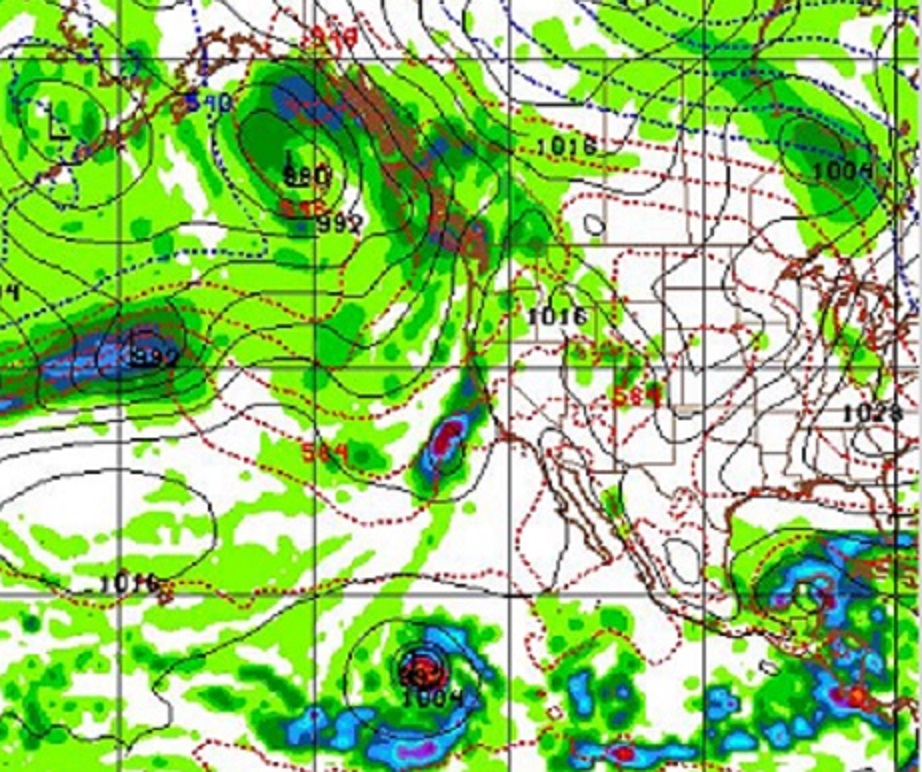
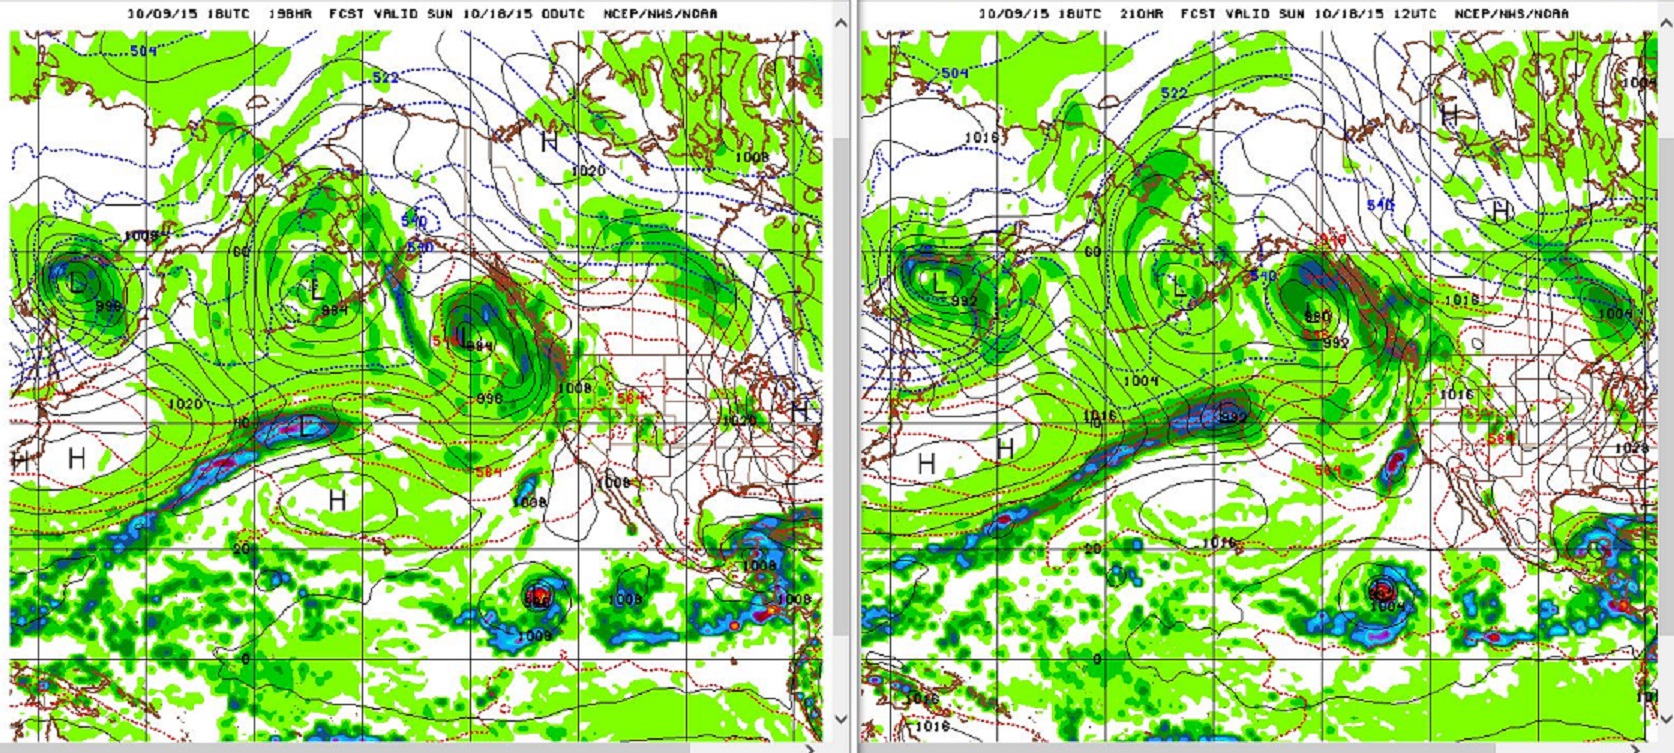
Another look at the same three days we have been looking at, namely next Saturday, Sunday, Monday, the 17th, 18, and 19th, basically next weekend. Strangely, moisture approaching Northern California but not from any tropical influence like we saw in yesterday’s model run. Nora remains deep in the tropics far away from California. It is really not unusual to have large differences from run to run. The Nora forecast is a pretty big change. However, even with the Nora change, the model still engineers significant moisture into Northern California. In this run, that is weak Nora in between Hawaii and the soon to develop Olaf. Next weekend still looks interesting for at least Northern California, that is at least some green hanging around.
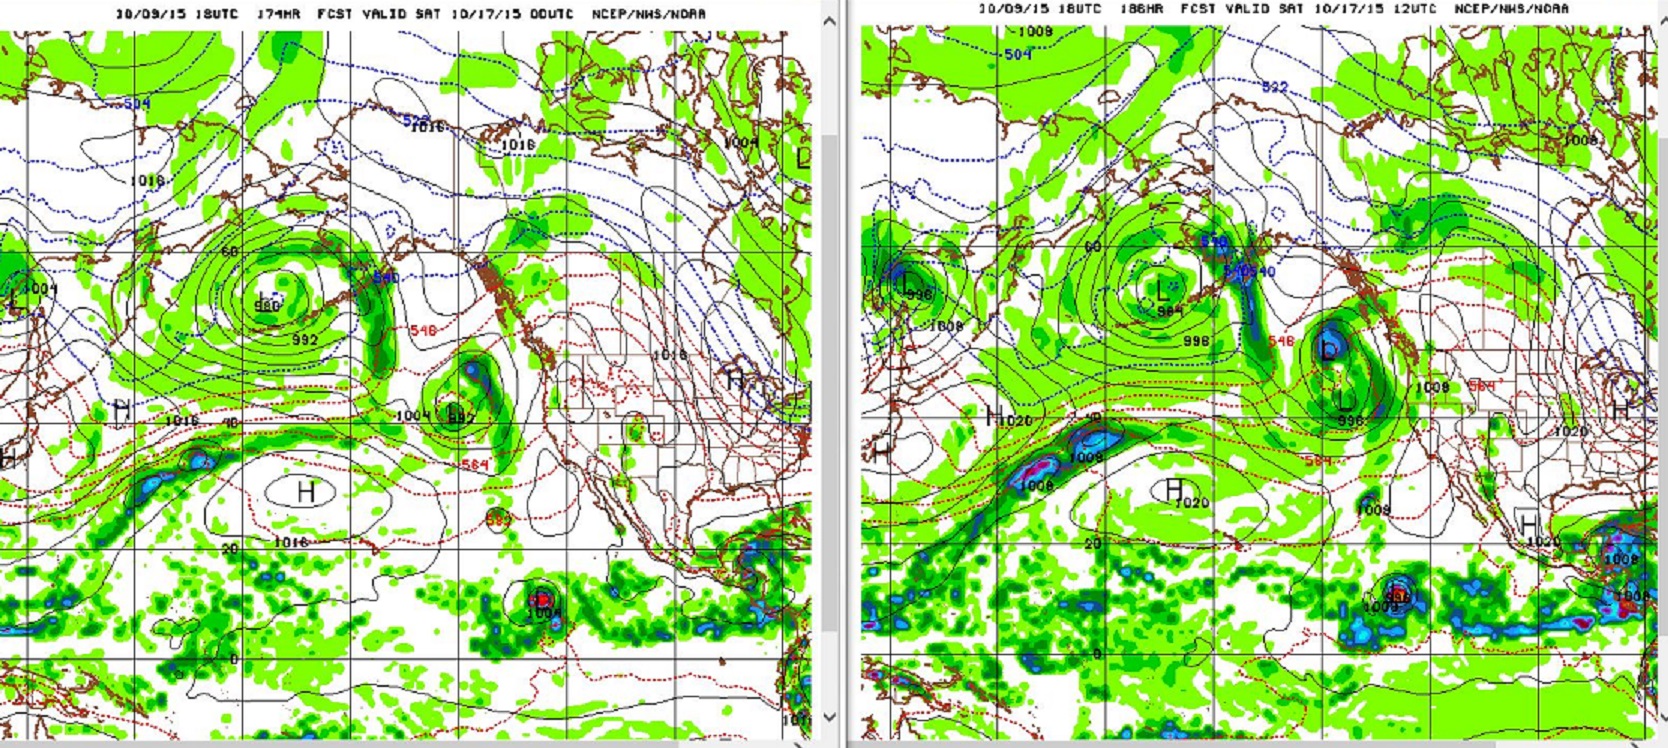
GFS 18z run 162 hour forecast for Saturday October 17, 2015 12z
If this forecast actually verified it would be a very welcome wet October weekend in parts of California.
GFS 18z run 186 hour forecast for Sunday October 18, 2015 12z
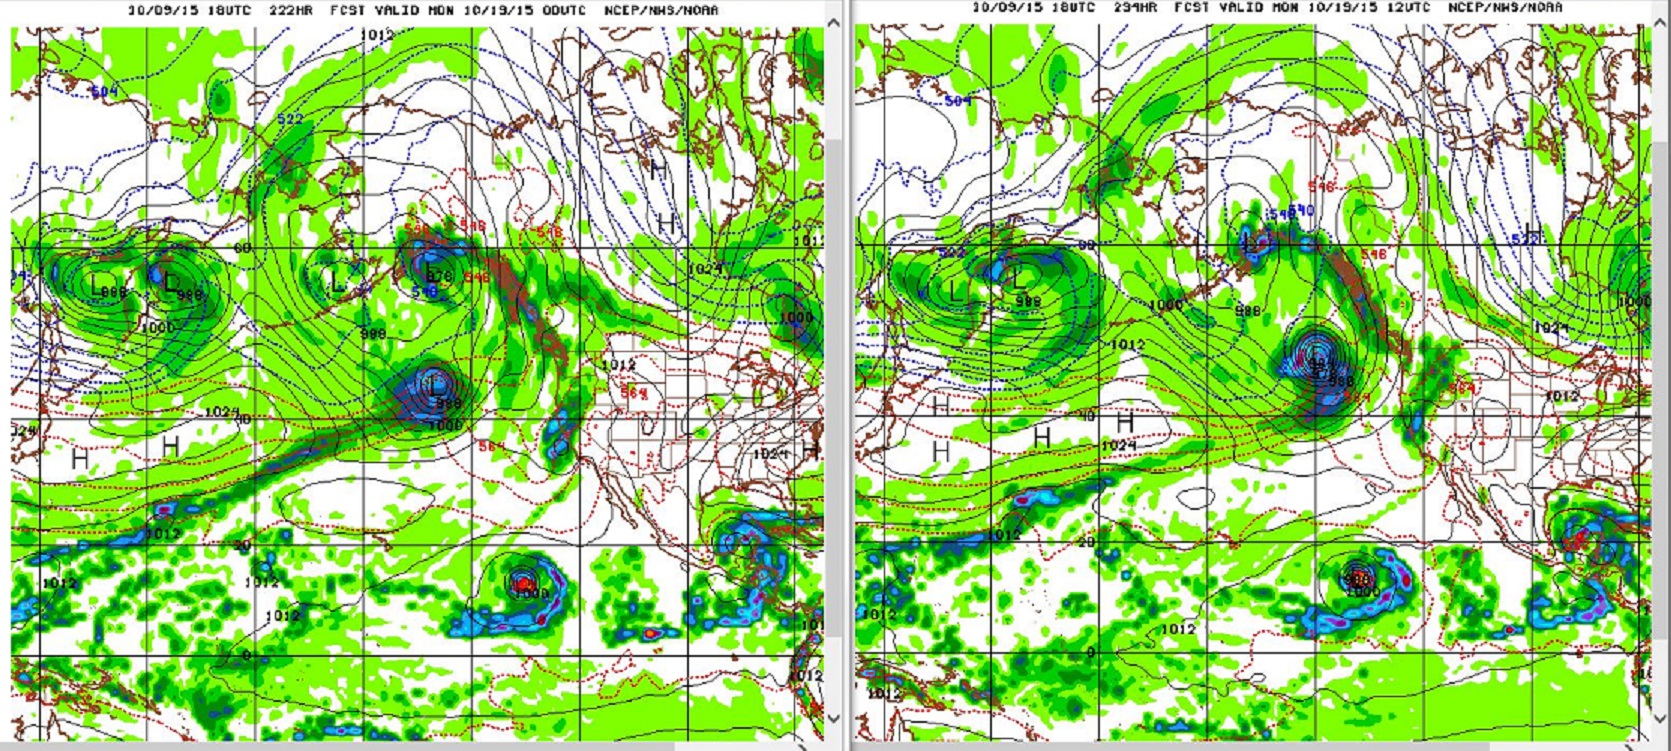
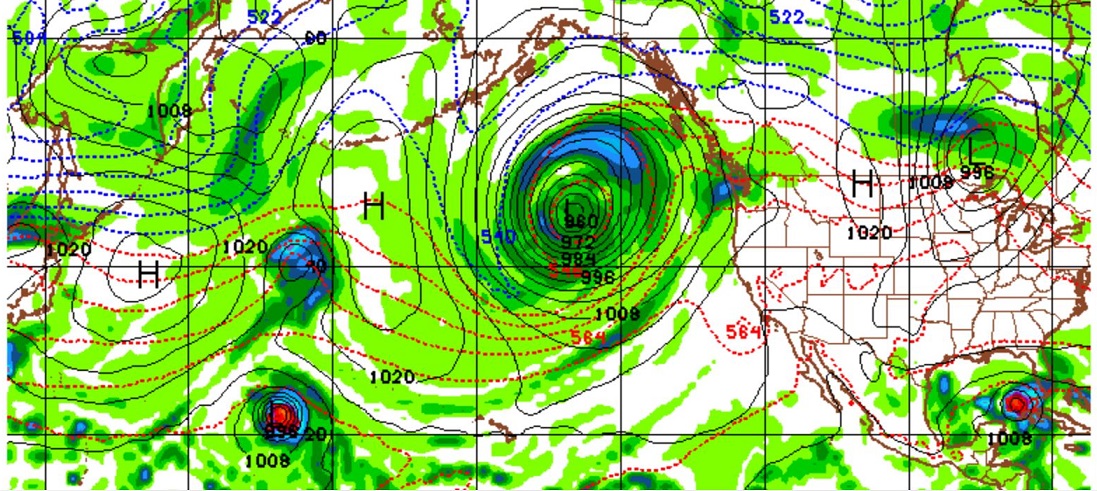
From the Blog several days ago, “GFS model for the Pacific at 300 hours or about 12 days out shows a 960mb low”. This was on the 7th so, a 12 day forecast would be around Monday the 19th. so, ….
The 18z run shows a rather small unimpressive 982mb low for early Monday the 19th.
GFS 18z run 210 hour forecast for Monday October 19, 2015 12z
Where as the 00z run shows a large rather impressive 956mb low for early Monday the 19th.
GFS 00z run 204 hour forecast for Monday October 19, 2015 12z
This is just different runs of the same model. Forecasters have several models to choose from, all run several times a day. Weather forecasting has its challenges. The one clue consistent to all four days we have looked at is this “960mb” low lurking somewhere west of Washington State on Monday the 19th.
These runs also lost interest in anything too serious in the Gulf of Mexico. Although still an area to watch, big high to north, old front, moisture gathering, definitely a tropical breeding ground.
The next big test for the 2015 El Niño comes Monday when the next round of weekly anomaly numbers are released. 1997 jumps two tenths in the coming week, will 2015 keep pace?
16SEP2015 29.0 2.3 17SEP1997 28.9 2.2
23SEP2015 29.0 2.3 24SEP1997 28.9 2.2
30SEP2015 29.1 2.4 01OCT1997 29.1 2.4
07OCT2015 Monday 08OCT1997 29.2 2.6
Learn more in my latest e-book El Niño: The WILD side of the weather cycle…
What we know, What we don’t, and Why you should care!

Wild Bill