December 28, 2015
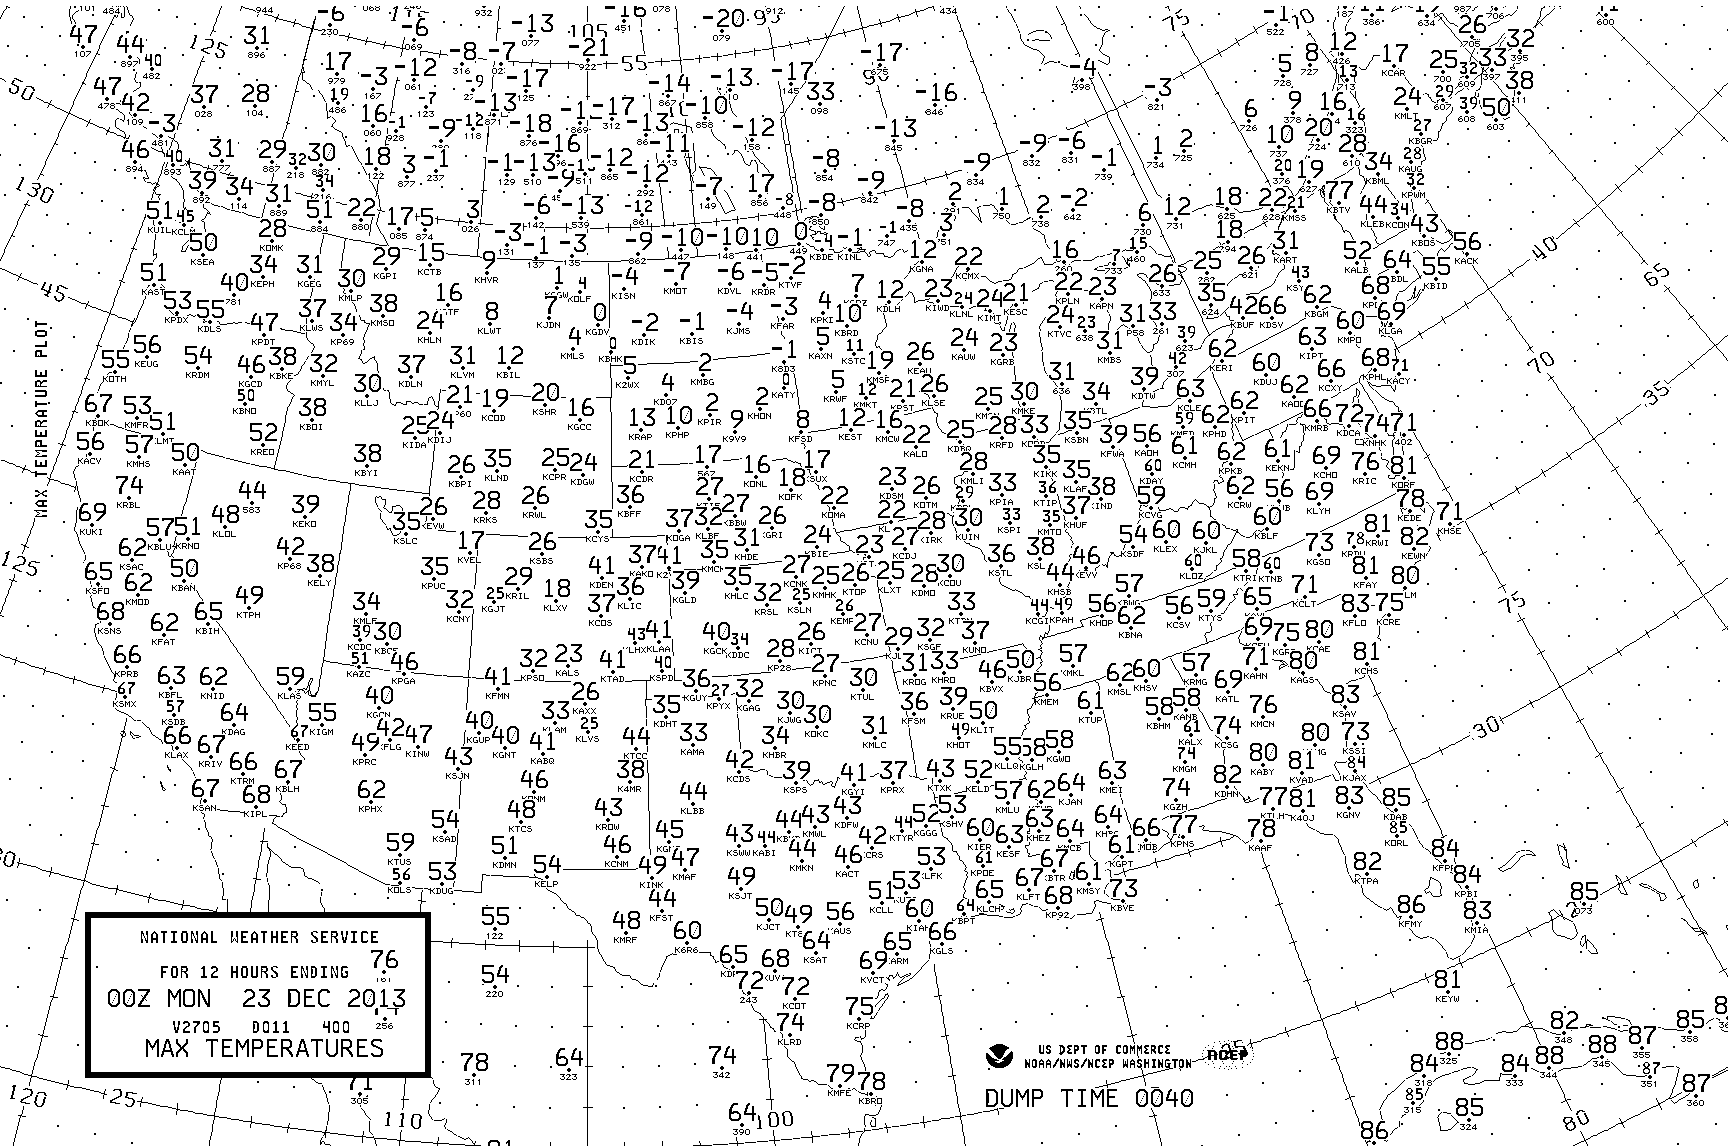
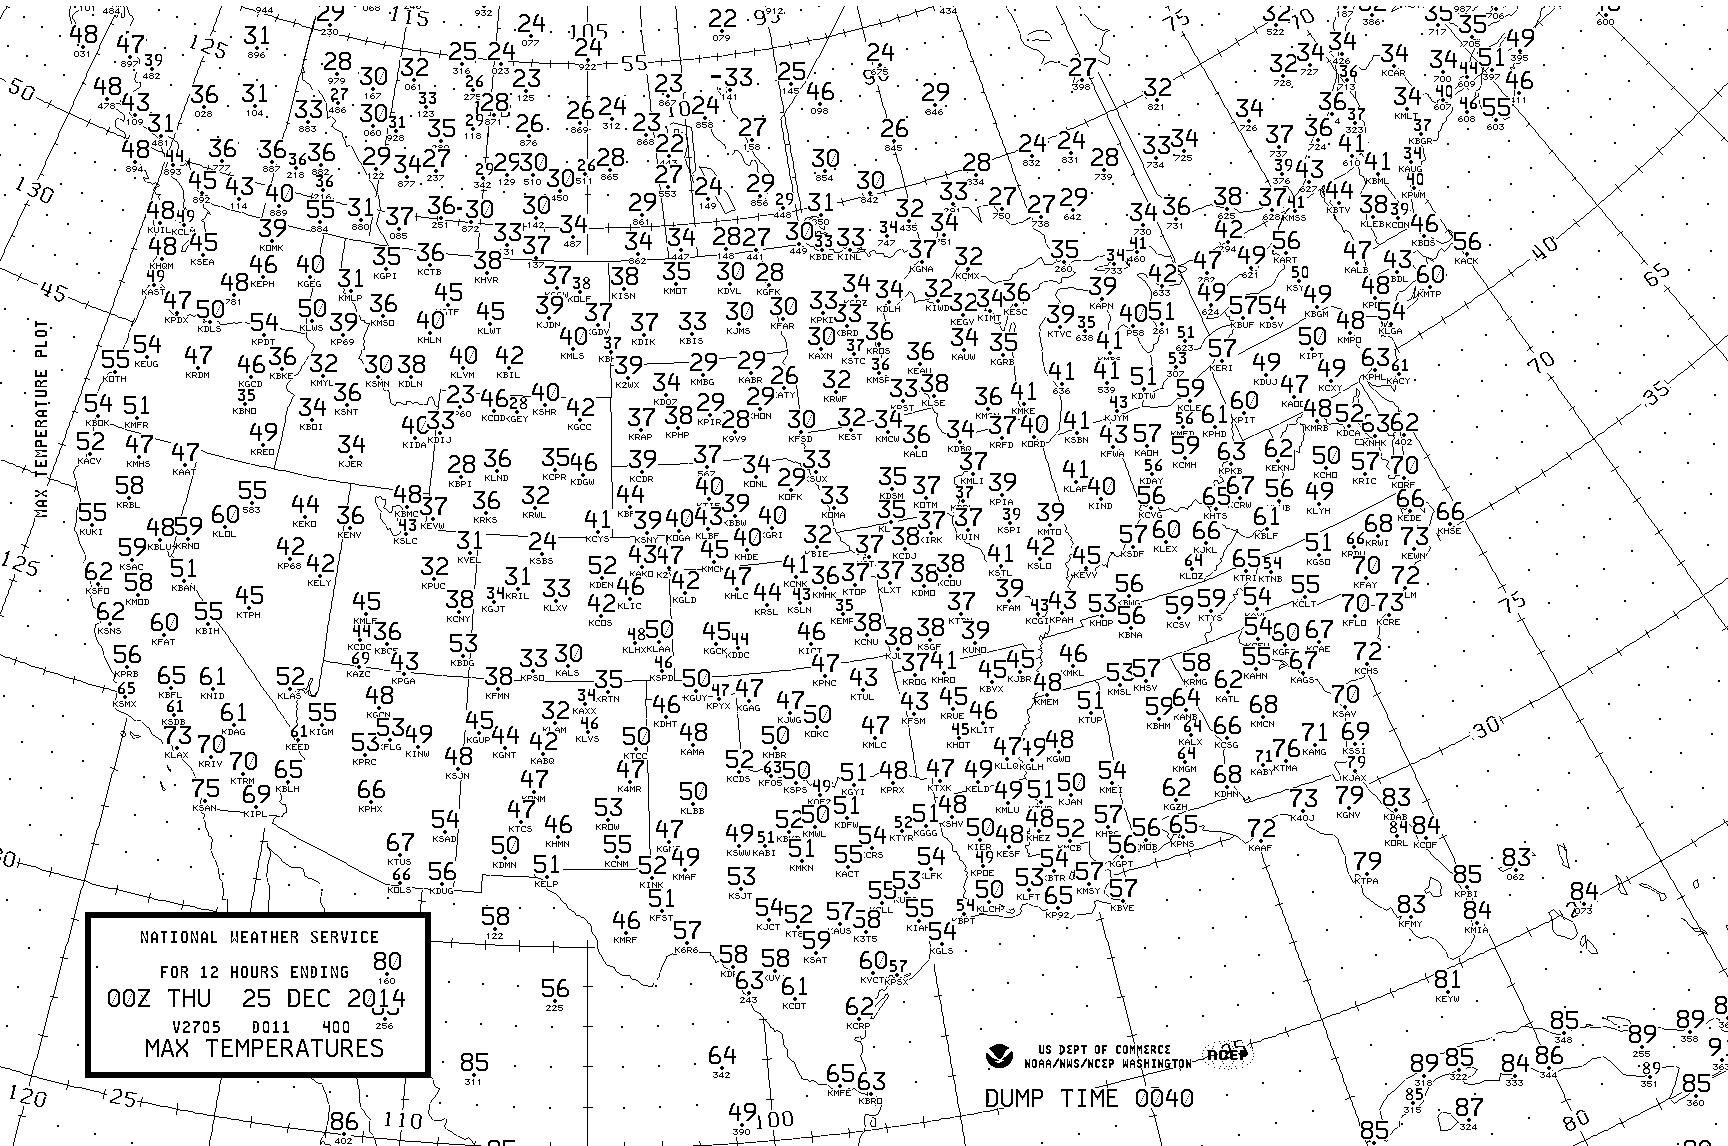
Not just a warm Holiday for some in the East, but a record warm Christmas Holiday. This is just a sample of the hundreds of record high temperatures that have been set across the eastern half of the nation in recent weeks. Some locations like New York’s Central Park set a high temperature record on both Christmas Eve and Christmas Day. Albany New York was 15 degrees warmer than any other Christmas Eve on record and Burlington Vermont was 17 degrees warmer than the previous record. In places like Vermont, where a White Christmas is expected, temperatures nearly 40 degrees above normal are not only noticeable but crippling to the ski and winter industries. Ice and snow just don’t hold up to temps in the 60s and lower 70s.
December 24, 2015 Record Highs Christmas Eve
Central Park NYC 72R 1131 AM 63 1996
Albany ALB 72R 220 PM 57 1941
Boston BOS 69R 359 PM 61 1996
Hartford BDL 69R 259 PM 59 1996
Providence PVD 69R 404 PM 64 2014
Burlington BTV 68R 154 PM 51 1957
December 25, 2015 Record Highs Christmas Day
Central Park NYC 66R 1231 AM 64 1982
John F. Kennedy JFK 64R 256 PM 58 1982
Providence PVD 64R 228 PM 63 2014
Worchester ORH 60Rt 153 PM 60 1964
Philadelphia PHL 68Rt 225 PM 68 1964
Washington Dulles IAD 70 215 PM 71 1982
Atlanta ATL 75R 452 PM 72 1987
Athens AHN 77Rt 254 PM 77 1982
The unusually warm weather not only set records, but also set the stage for several rounds of deadly severe weather. Several fatalities occurred across Mississippi and Tennessee from a long track EF-3 tornado on Wednesday the 23rd. An EF-2 tornado struck a Birmingham suburb on Christmas Day. Damage was significant but no fatalities occurred. A new storm system on the 26th was still able to take advantage of the unusually warm weather. An EF-4 steamrolled the Dallas suburb of Garland killing eight in the early evening hours.
Brief review of Holiday severe weather:
December 23, 2015, …10 fatalities were reported in Mississippi, six were killed in Tennessee. One tornado producing thunderstorm tracked 145 miles from the Mississippi River across the state and into Tennessee killing 7. Other fatalities occurred due to tornadoes, straight-lines winds and flooding.
December 25, 2015, … EF-2 tornado swirled across portions of McCalla and Bessemer Alabama, immediate suburbs of Birmingham, collapsing houses but not killing anyone.
December 26, 2015, …11 died in Texas after several tornadoes were reported in the Dallas area. In Garland, a suburb of Dallas, eight people died Saturday from an EF-4 tornado, three others died in Collin County just to the north.
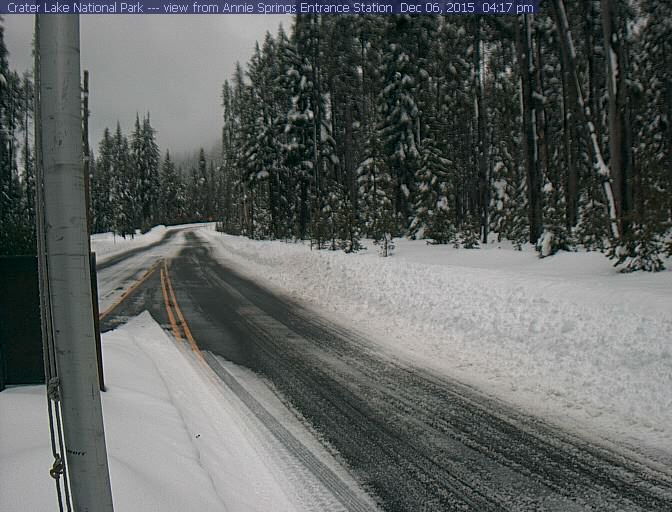
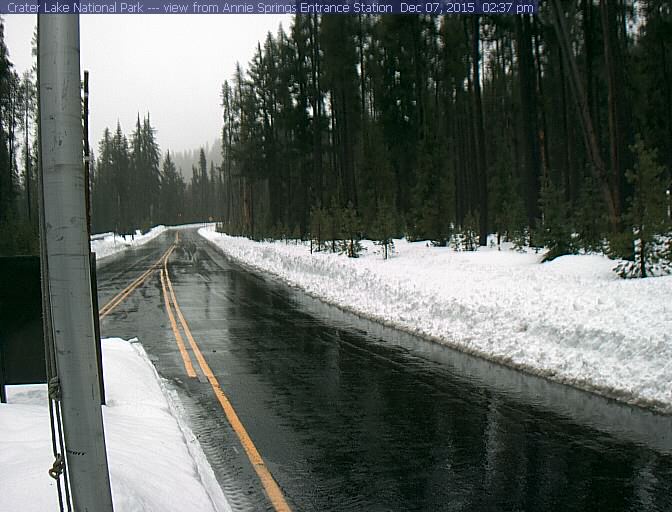
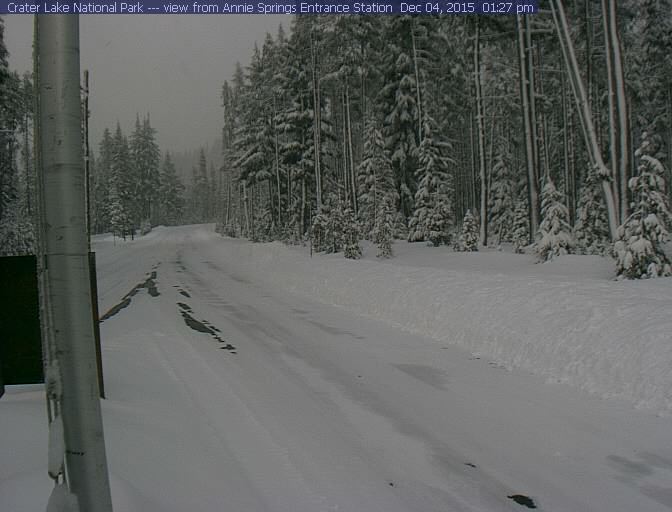
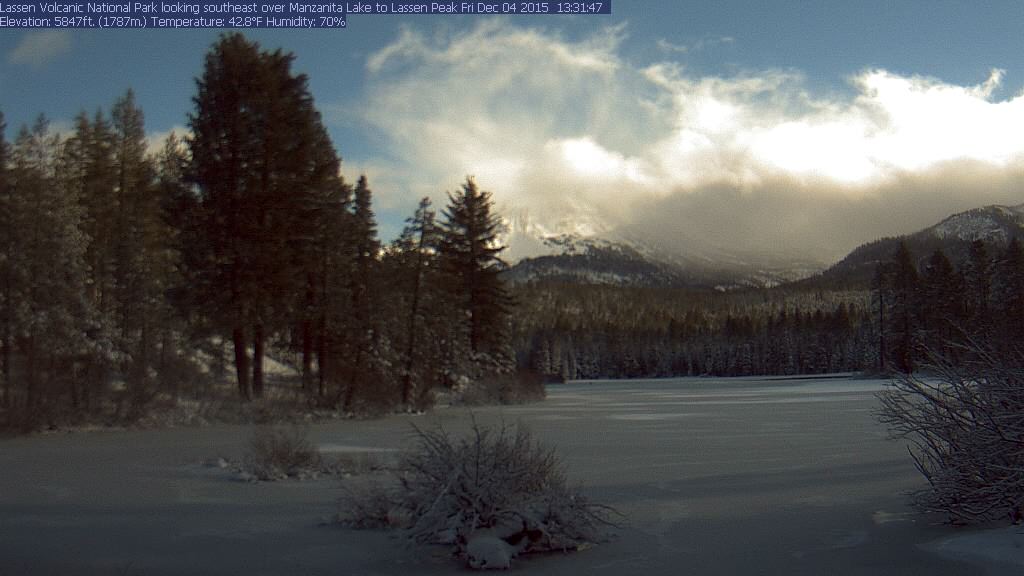
In contrast, the Cascades of Oregon looked quite wintry on the Holiday. Below are images from last Christmas, this Christmas and June 1st.
The Steel Visitors Center Crater at Lake National Park on Christmas Day 2014.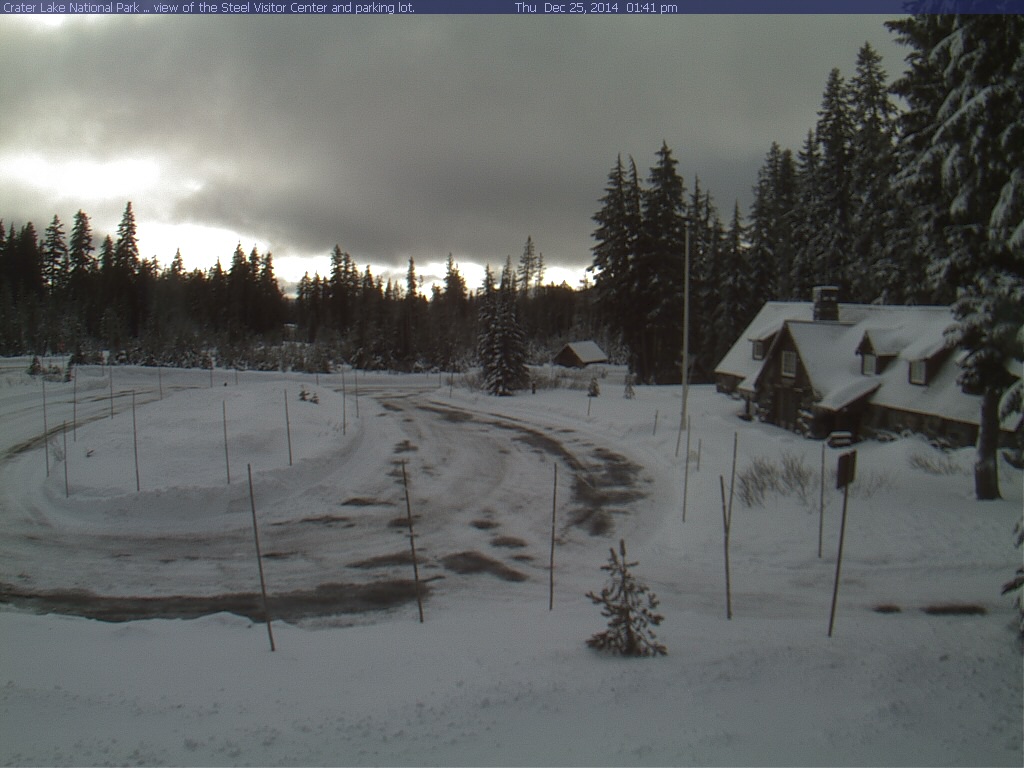
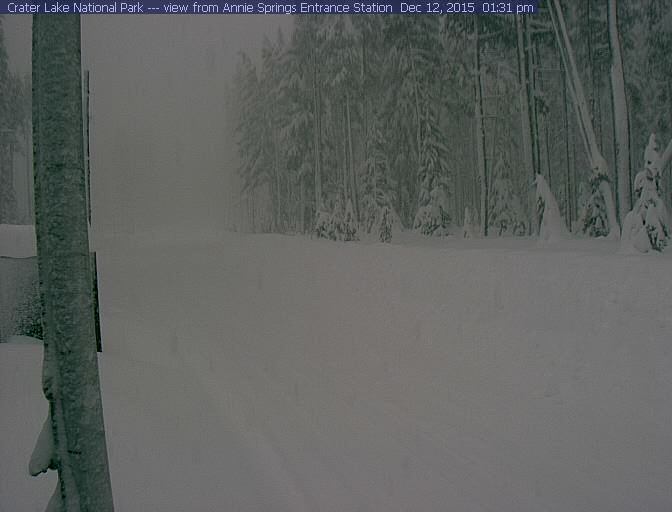
The Steel Visitors Center Crater at Lake National Park on Christmas Day 2015.
At 7050 feet the snow depth listed for Christmas Day 2015 was 111 inches, or a little over 9 feet. That is a full size van parked back left and the snow banks are well above.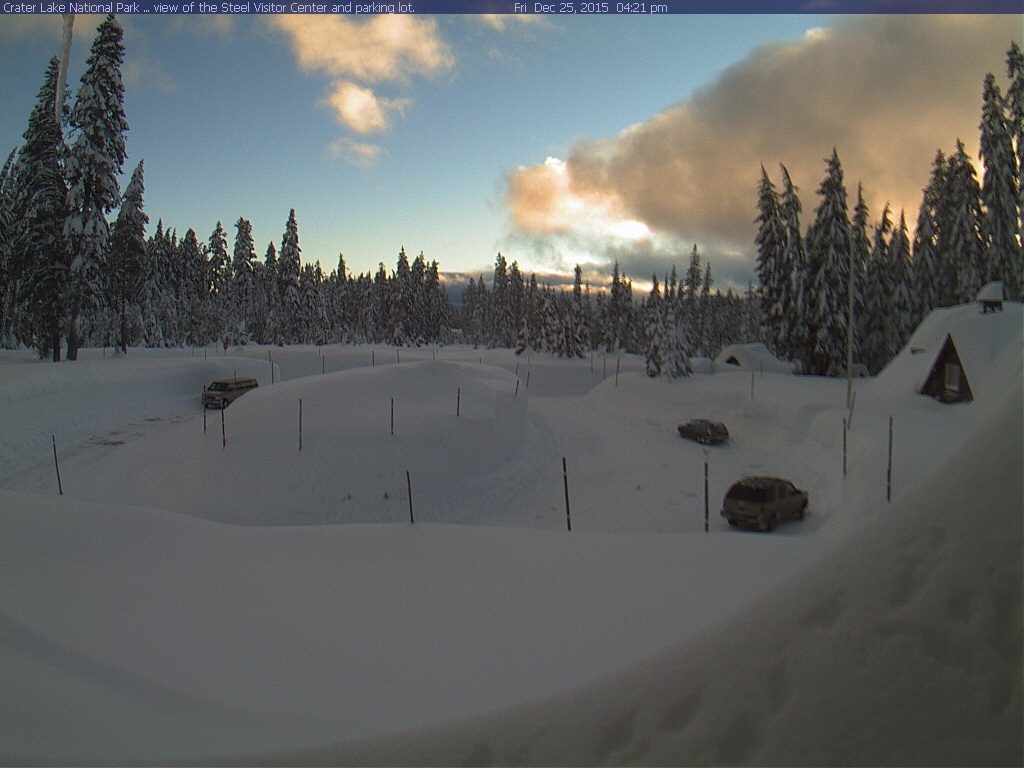
The Steel Visitors Center Crater at Lake National Park on June 01, 2014. Even in a drought year the snow cover lingers until June.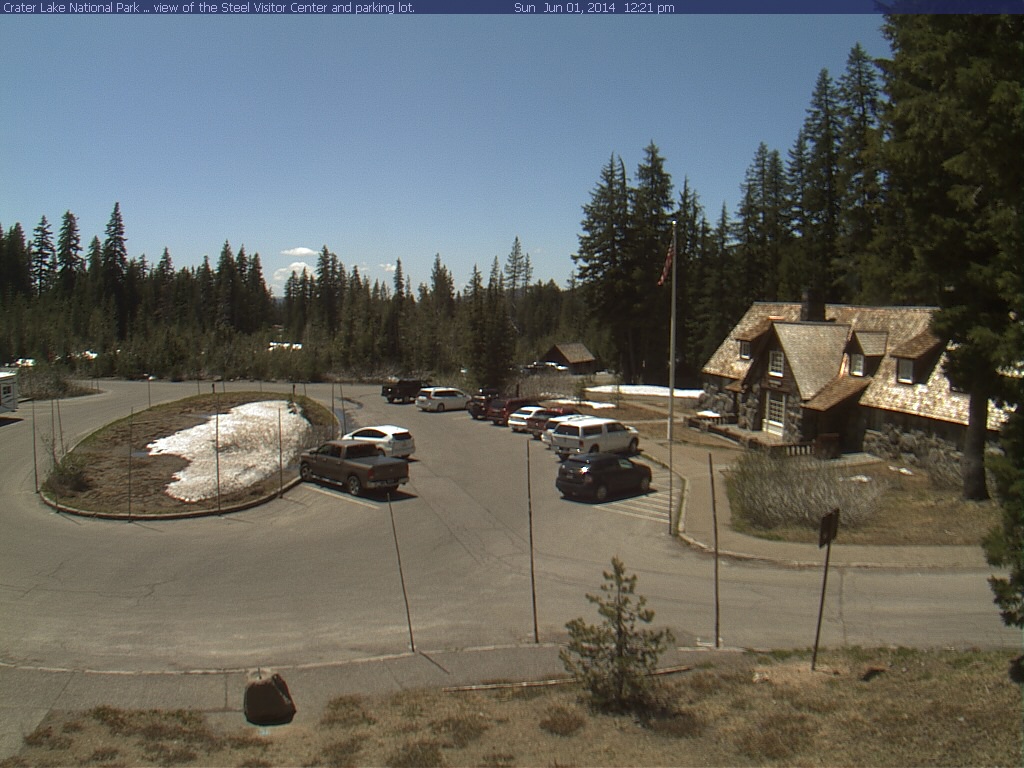
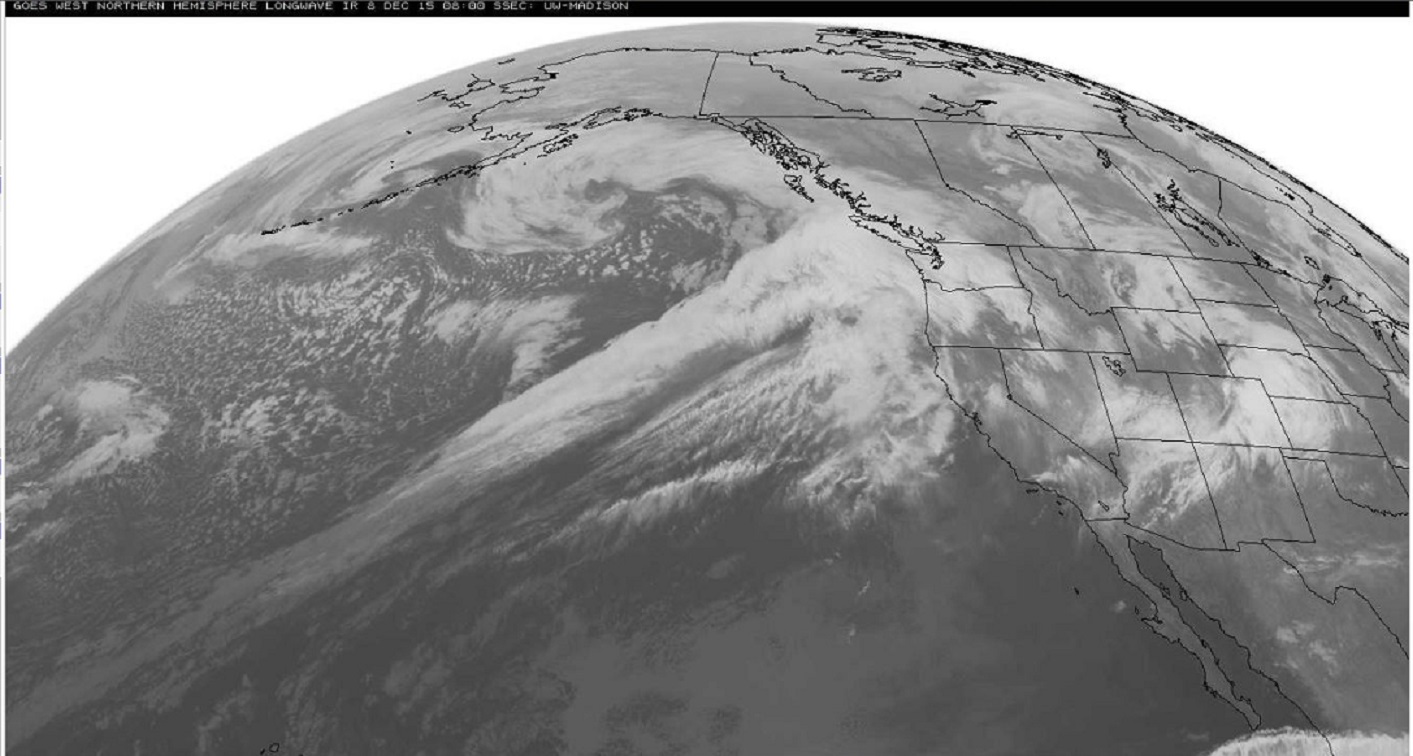
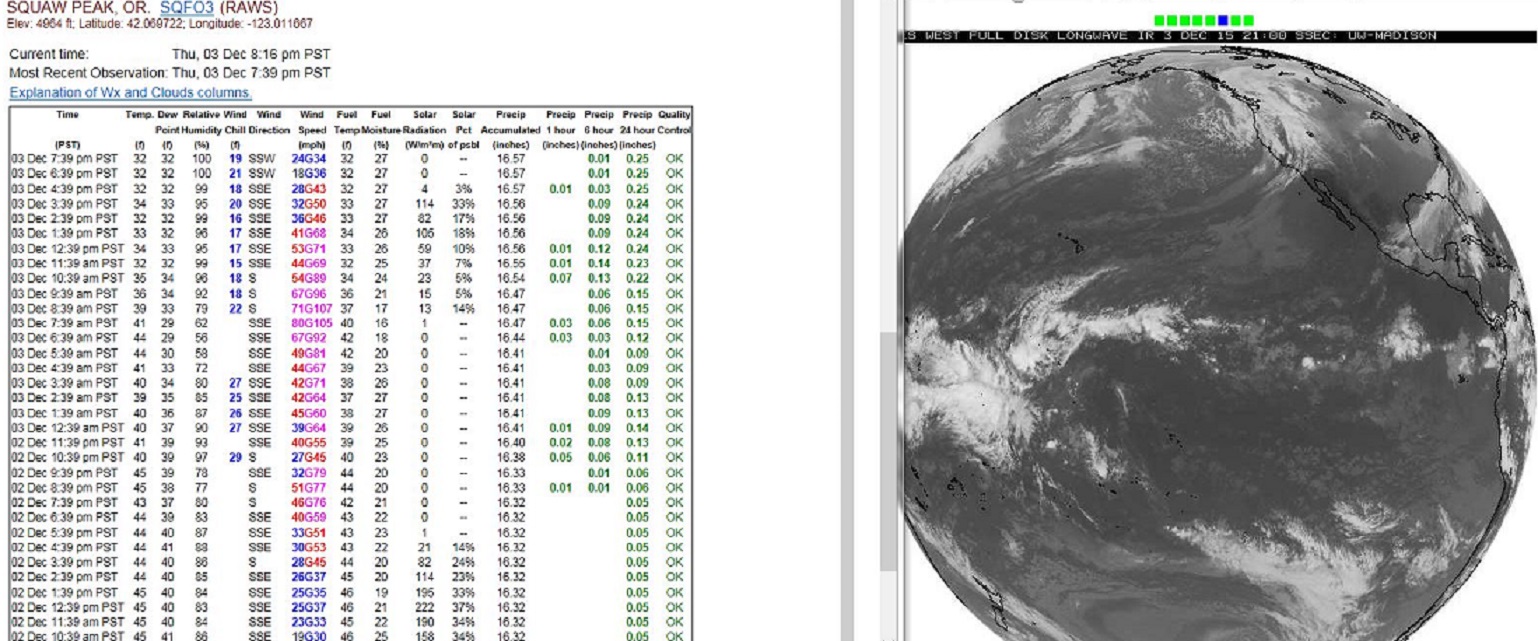
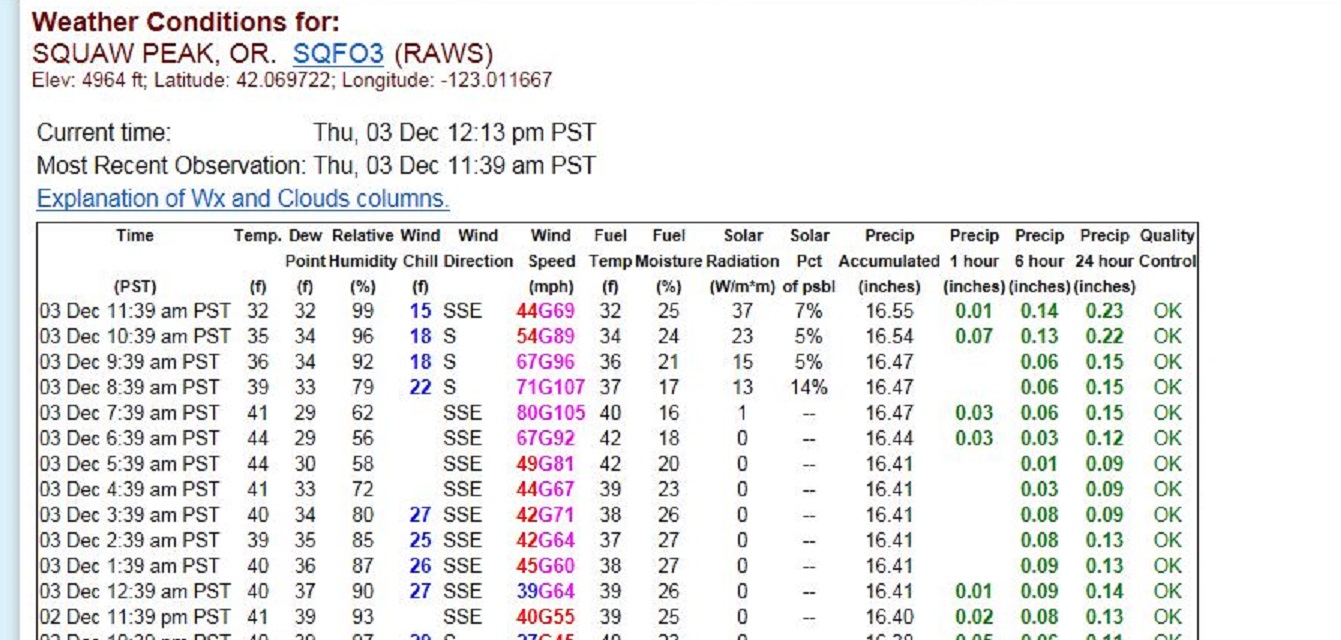
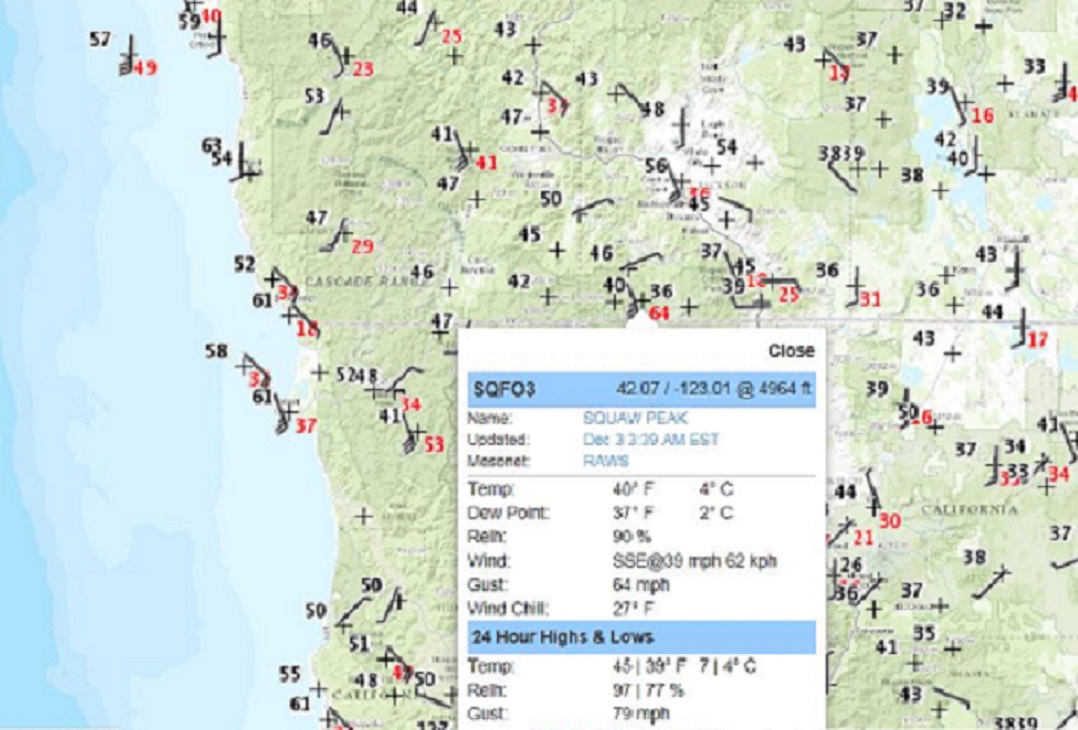
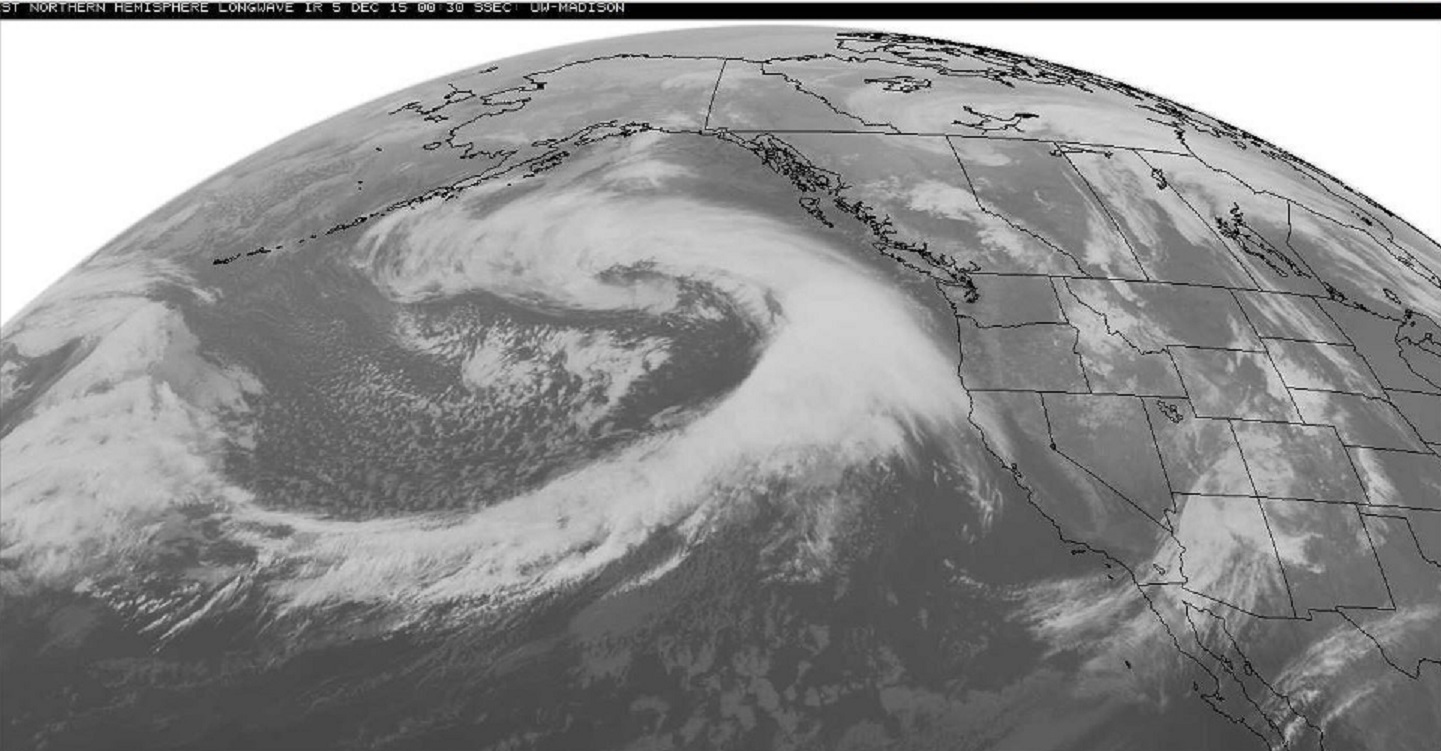
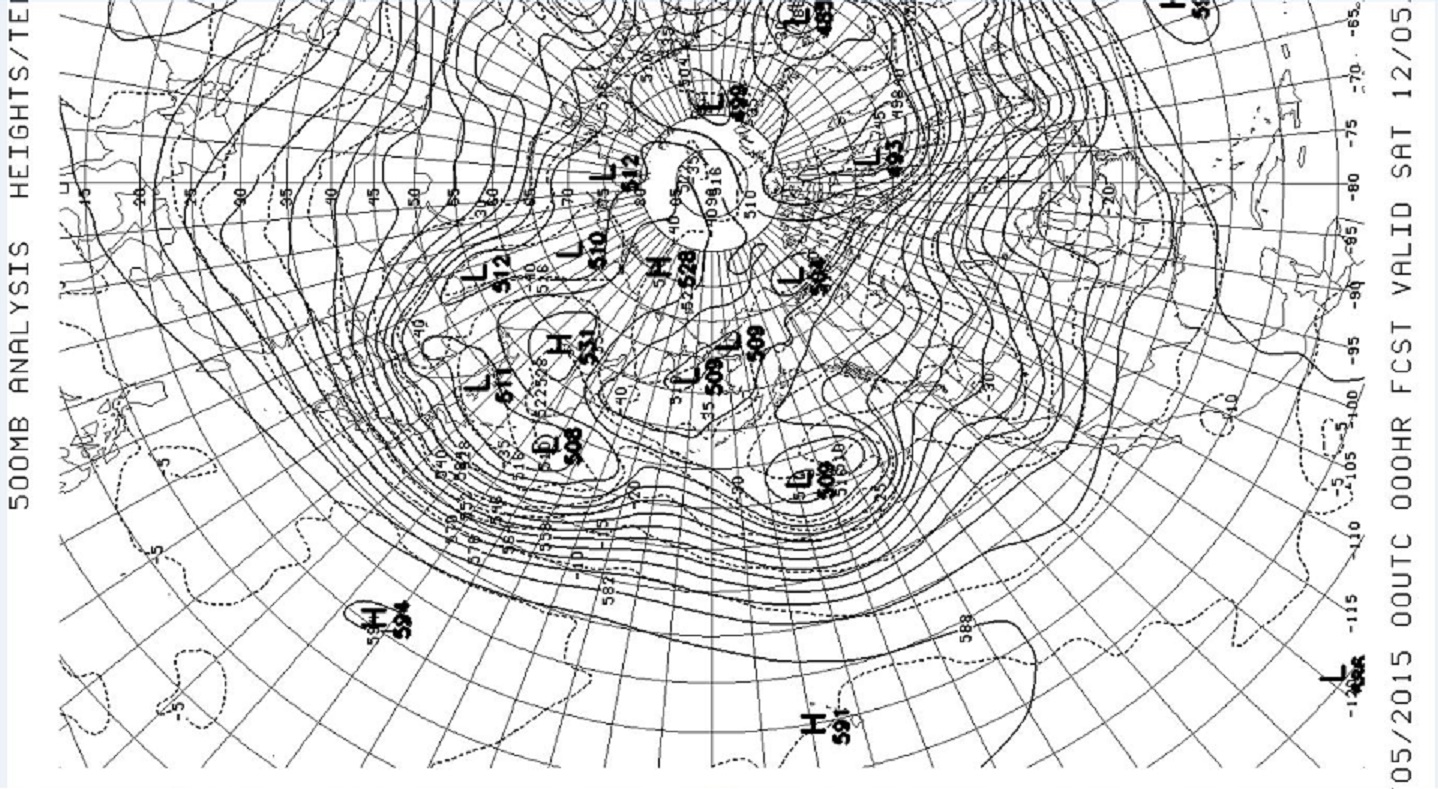
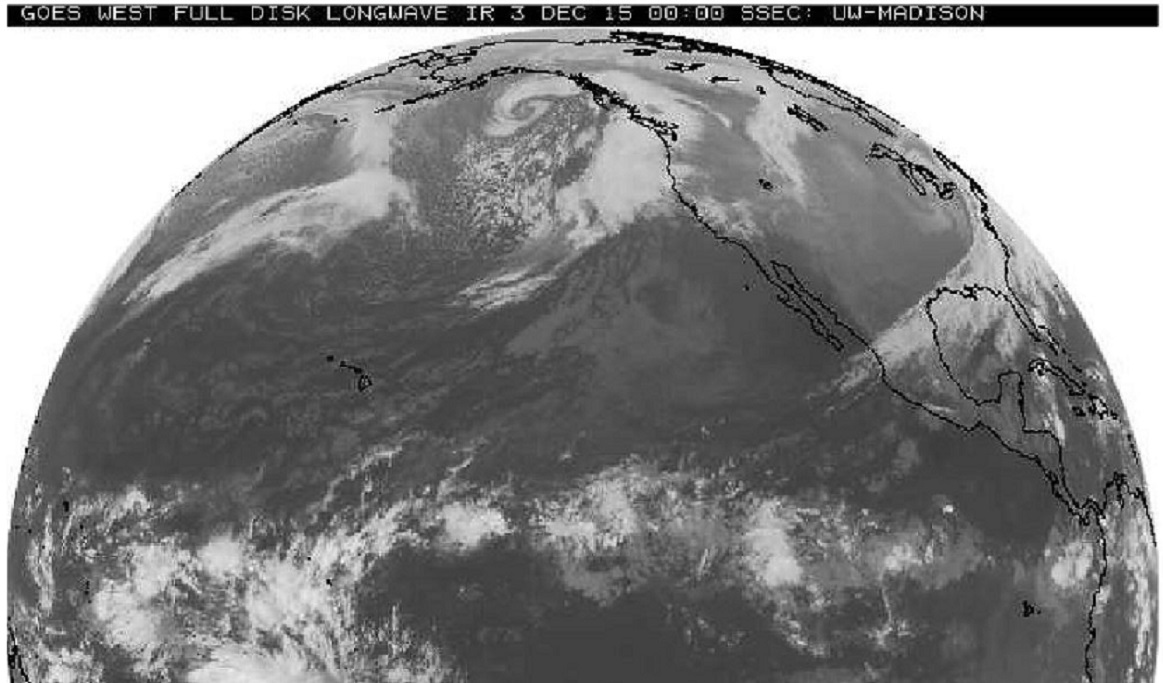
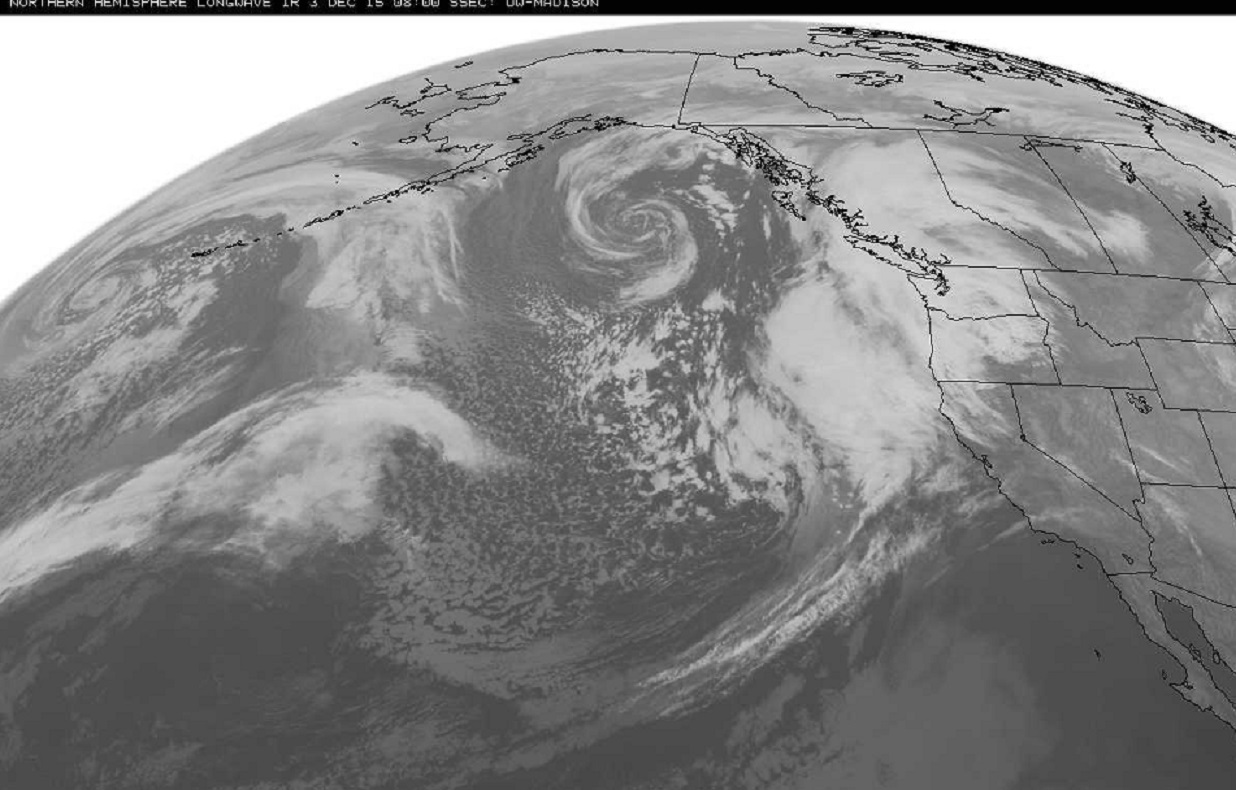
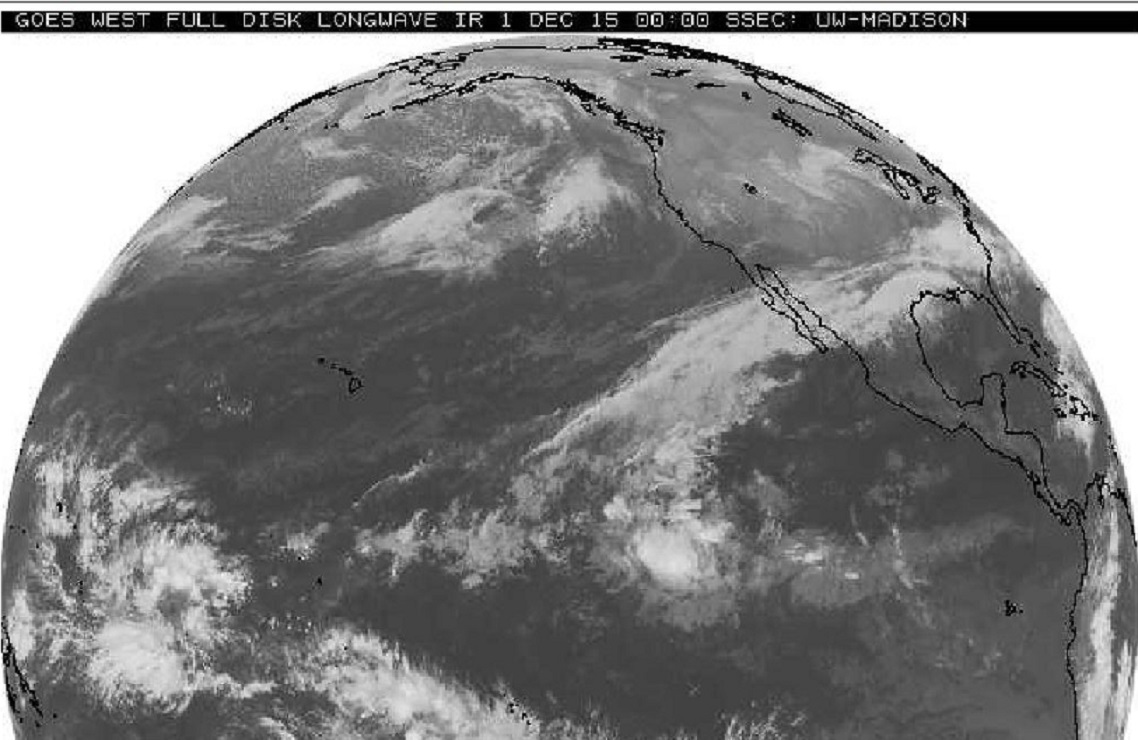
Just to show anyway you look at it, Crater Lake was buried for this Holiday. A series of West Coast storms have left there mark on the mountains of the West.
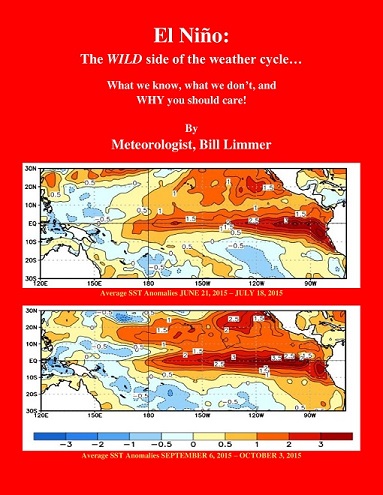
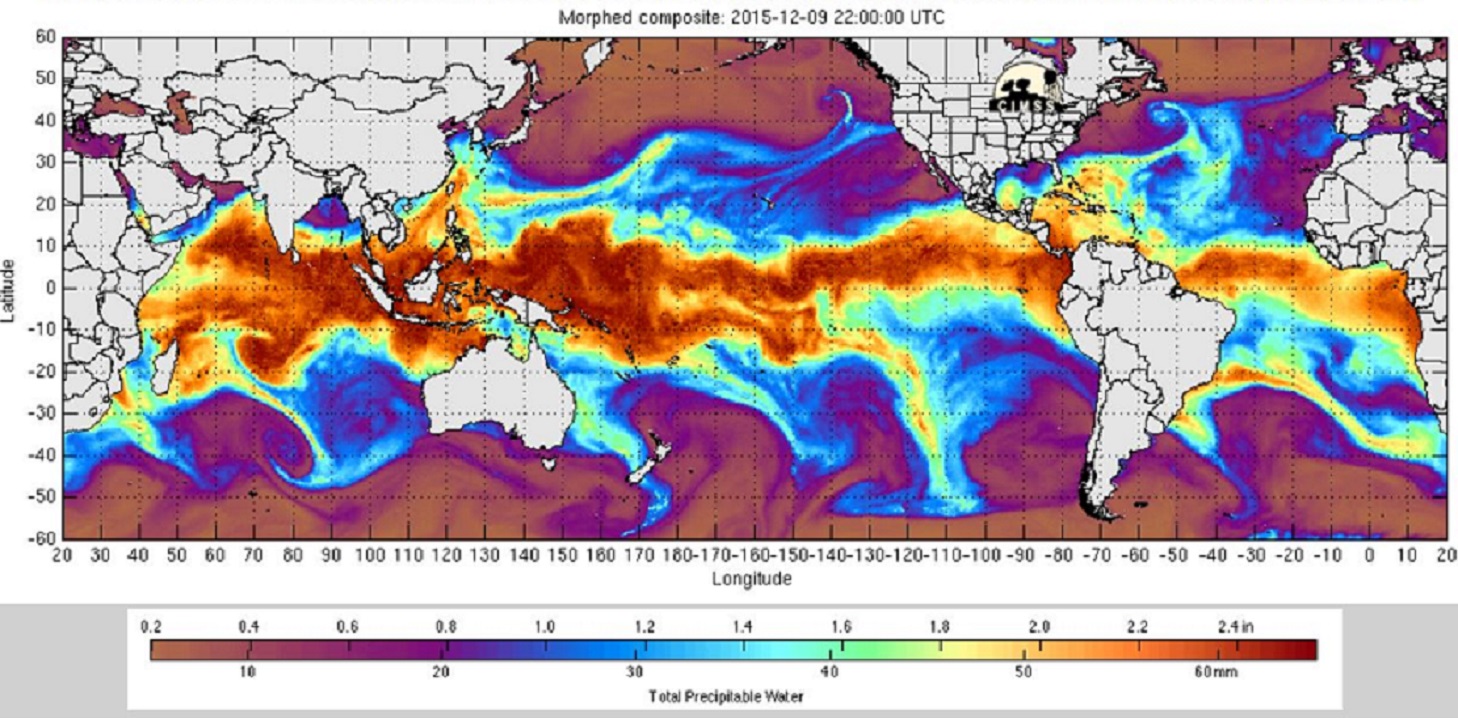
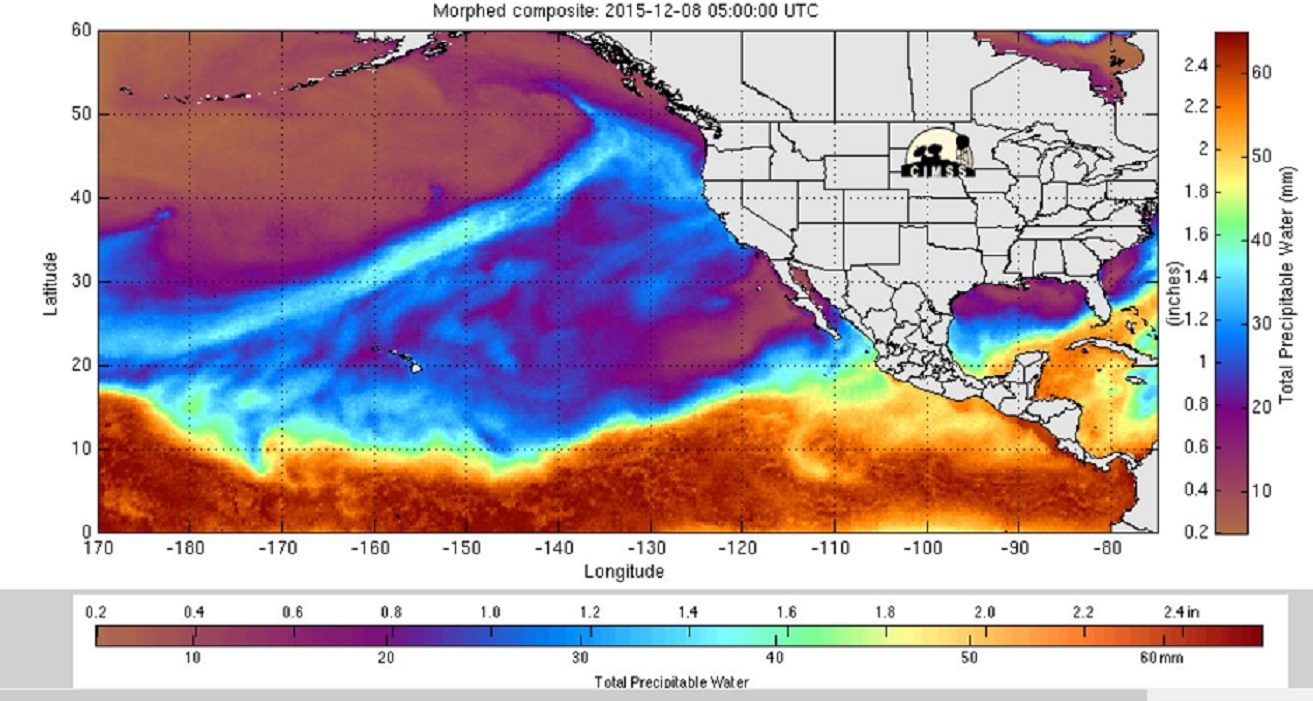
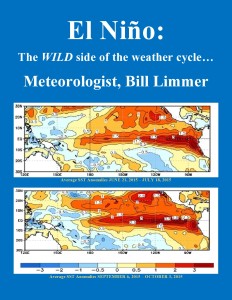
Learn more in my latest e-book El Niño: The WILD side of the weather cycle…
What we know, what we don’t, and WHY you should care!
I show how this years Pacific water temperatures compare to the 1982 and 1997 events and highlight the kind of weather episodes that these stronger El Niño’s tend to bring.
Central Park NYC 66R 1231 AM 64 1982
If you like the blog you will love the book.
Available at Amazon
Wild Bill.