March 28, 2019 Hers is a quick look at how to use the internet to follow this springs severe weather threat across the country and perhaps even in your own local area.
1st stop, … Storm Prediction Center, … https://www.spc.noaa.gov/
Find it, get familiar with it, and bookmark it to your favorites.
During the spring and early summer keep an eye on the daily “Convective Outlooks”. The redder the colors, the bigger the risk of bad weather. The color code at the bottom shows six shades of color, from light green to dark red. The two shades of green outlines depict a lower chance of a damaging storm, the redder colors are reserved for the higher chances of dangerous conditions. In the example below, The Prediction Center coded the outlook with darker yellow indicating an enhanced risk of severe storms. The day of this outlook, there were 49 reports of tornadoes, and 237 reports of severe weather. So the outlook does not have to be moderate or high, the redder colors, for significant weather to occur.
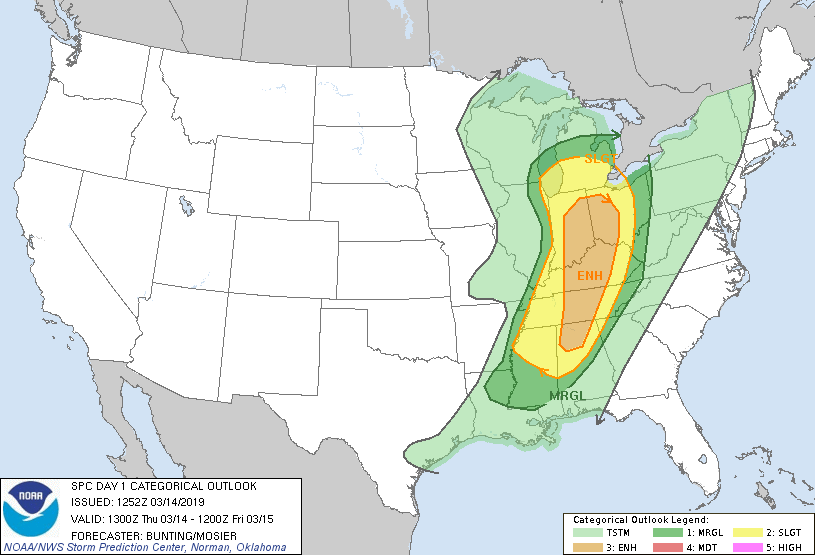
The above is the Day 1 Outlook was for Thursday March 14, 2019, which we will look at a little closer down the page a bit.
If you are in or near the Outlook area (especially the day 1 outlook) it is time to keep a closer eye on your current weather. You will want to monitor both the Storm Prediction Center (SPC) and your local National Weather Service(NWS). SPC is responsible for issuing the Severe Thunderstorm or Tornado Watches. But it is you local NWS office that issues specific warnings when storms are identified as potentially severe.
2nd step,… National Weather Service Home Page,.. https://www.weather.gov/
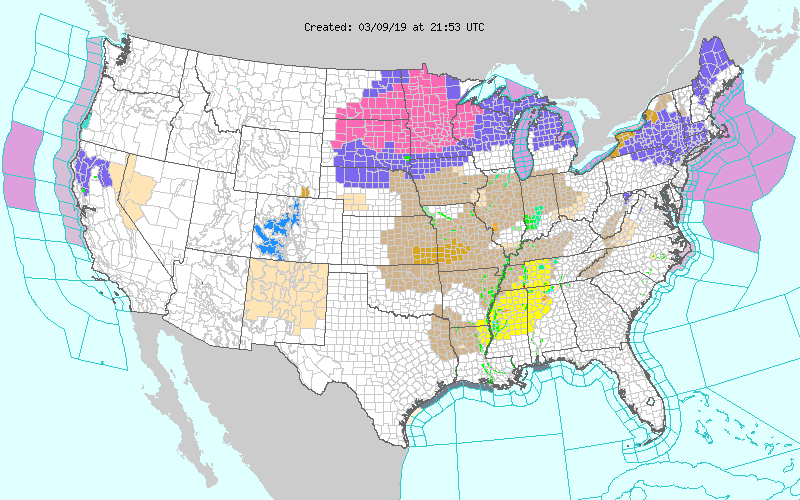
Again, … Find it, get familiar with it, and bookmark it to your favorites. Put this favorite bookmark near the page, Storm Prediction Center (SPC), we just saved above. Once you determine your location relative to the Convective outlook it is time to ask the question, Am I included in any Watches, Warnings, or Advisories? This is where the NWS home page can be instrumental. It is a one stop shop for all Advisories issued by any office across the country. The Warning page below is actually for the 9th not the 14th, but still an example of a Tornado Watch, shown with yellow shading, across parts of Alabama, Mississippi, and Tennessee.
So we have gone from Day 1 Convective Outlook to a Tornado Watch, time to dig a little deeper. If you still have power and access to a local TV station, one safe way to monitor the situation is just keep TV tuned to the station known for their news and weather coverage. If a Tornado Warning is issued in their broadcast area they will cut into regular programing and show you where the problem is. Most TV stations have access to the newest technology and in a serious situation this option is hard to beat. But the purpose of this blog however is to show how to take advantage of the internet when other information sources may not currently available.
So, a Tornado Watch has been issued for your area, and now you have reason to believe Warnings are also posted. It is now time for the all important step three.
3rd phase, …start paying attention to a presentation of your National Weather Service radar. You have national, regional and local radar displays to choose from. When bad weather develops or moves into your local area, the local radar option is best. The reflectivity mode not only shows precipitation intensity, but also which storm cells are currently covered by a specific Warning.
Below I have gathered a few examples of tornado producing thunderstorms that have just occurred in recent weeks. My hope is that these illustrations may help you identify and track severe storms with just an internet connection and various NOAA websites..
March 14, 2019 …0506 PM CST, …KBMX Birmingham Alabama weather radar. Reflectivity, or precipitation to the left, Storm Relative Velocity, rotation, to the right. For the illustration below, I choose Birmingham NWS Radar and selected Reflectivity. Then I open a new tab or window and selected the Storm Relative Velocity and placed it next to the Reflective window. With the two windows side by side, you can see the Tornado Warned storm has heavy precipitation, red, even a hint of purple, possible hail, north of the “ING” in Birmingham on the left panel. Now look to the same area on the Relative Velocity panel to the right, the red and bright green colors close together north of the “ING” in Birmingham indicates strong wind blowing in opposite directions over a very short distance very near our potent storm. Analysis would suggest a severe, rotating thunderstorm capable of large hail and a possible tornado. Several tornadoes did indeed occur shortly after 5pm local time across Blount County Alabama in associate with the Tornado warned storm illustrated below.
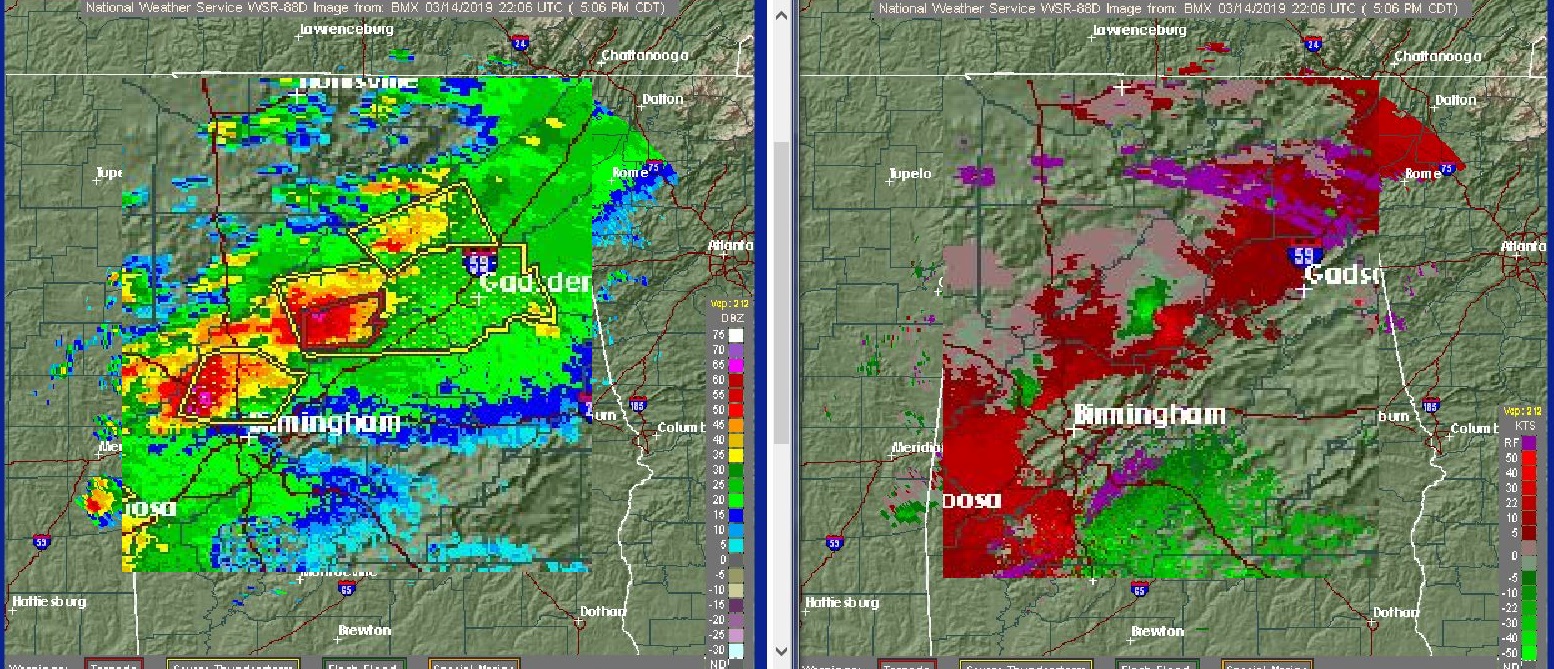
After examining the above, you may ask, what about the green, red couplet on the Storm Relative panel just northwest of the “B” in Birmingham? Well that also indicates a severe storm with a high probability of rotation. The NWS is closely monitoring that storm respecting it’s potential with a yellow box, a severe thunderstorm warning.
Some 45 minutes later it is the southern storm cell that carries the Tornado Warning. The lead cell, now approaching Gadsden, still shows signs of broad rotation but is only covered by a Severe Thunderstorm Warning. Tornadoes were reported in St. Clair County Alabama in association with the Tornado Warned cell in the graphic below.
March 14, 2019, … 0553 PM CST, …KBMX Birmingham Alabama weather radar.

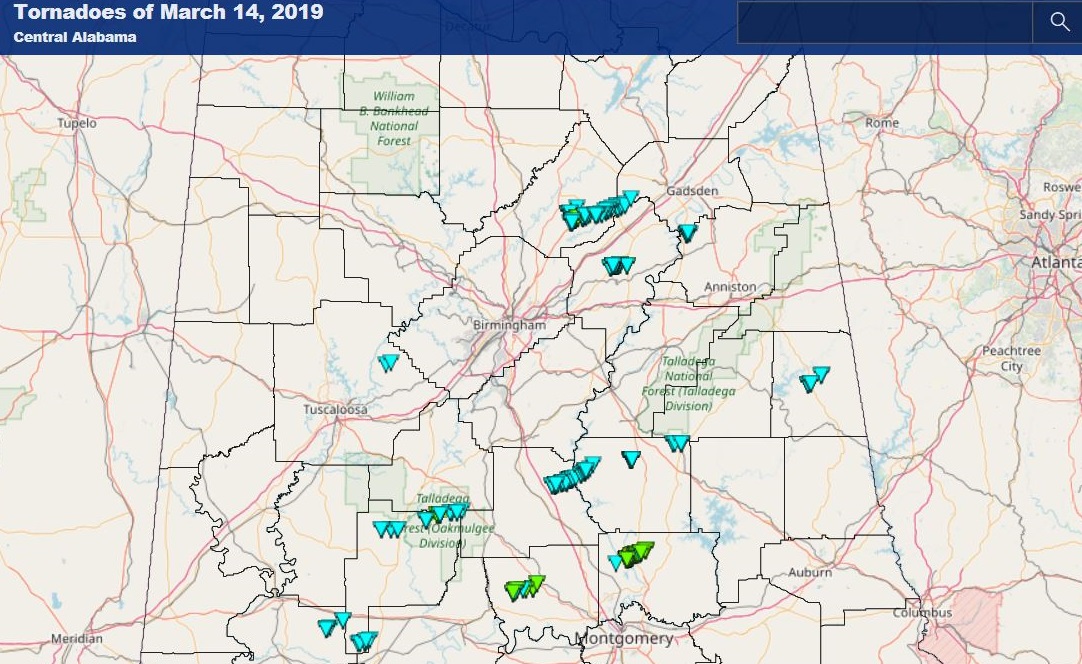
Below a map of the 15 tornadoes reported in Alabama on Thursday March 14, 2019. The radar snapshots above focus on the two tornado tracks north of Interstate 20 east of Birmingham.
One more example below shows local radar representation of the storm that killed 23 on that Sunday in early March. This radar snapshot was taken about the time the storm was at it’s EF4 strongest, causing destruction and taking lives.
March 03, 2019 …0214 PM CST, …KMXX Maxwell AFB weather radar also called East Alabama. Again like the above examples above, Reflectivity, or precipitation to the left, Storm relative Velocity, rotation, to the right. The red green couplet in the velocity frame south of the “bu” in Auburn identifies to location of the damaging and in this case, deadly tornado.
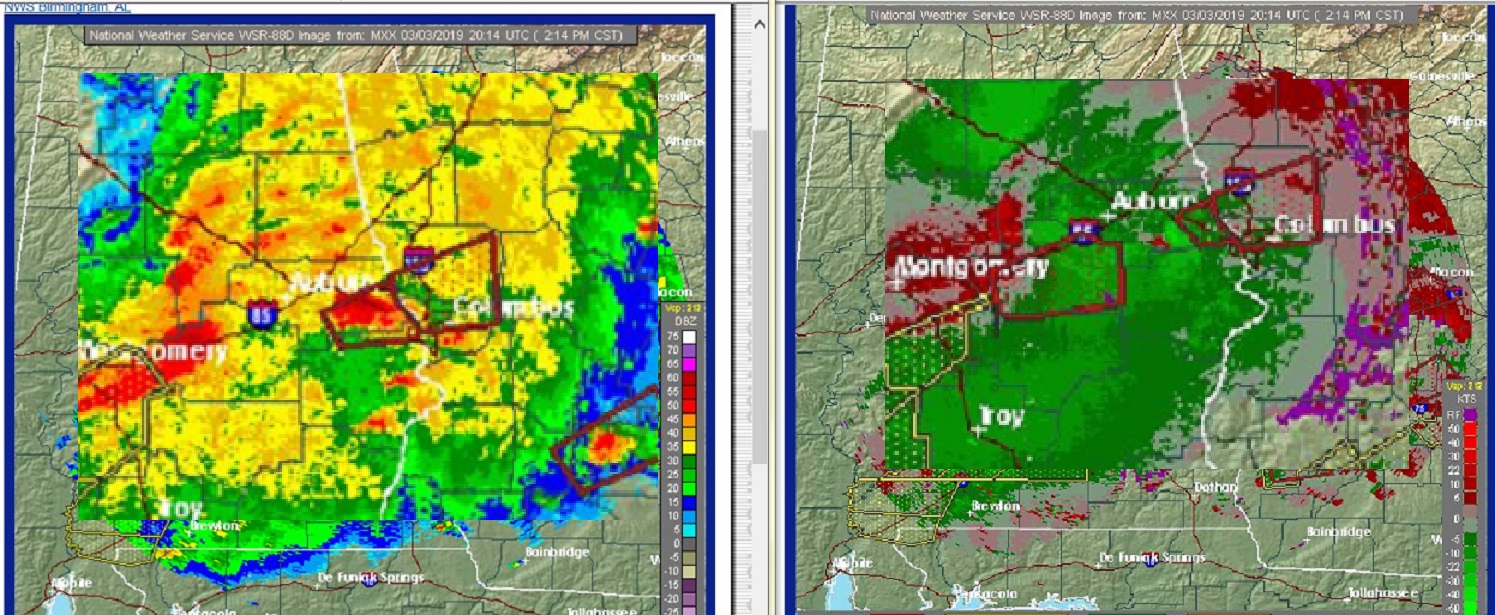
In a damaging weather situation, SPC will track the severe potential along with your local NWS office. SPC uses what they call Mesoscale Discussion (MDs) to give insight to what active weather is occurring or expected to occur within an official Watch area. Below is a rather unsettling discussion that was issued as the Lee County Alabama tornado was at it strongest.
The Mesoscale Discussion (MDs) issued 5 minutes after the radar depiction above.
Mesoscale Discussion 0148 … 0219 PM CST Sun Mar 03 2019

Mesoscale Discussion 0148
NWS Storm Prediction Center Norman OK
0219 PM CST Sun Mar 03 2019
Areas affected…far east-central AL and far western GA
Valid 032019Z – 032045Z
The severe weather threat for Tornado Watch 7, 8 continues.
SUMMARY…An intense tornado with experimental tornado guidance
suggestive of wind speeds 125-175 mph based on recent volume scans
of rotational velocity and the significant tornado parameter.
DISCUSSION…A very intense supercell tornado will continue to move
through a very favorable environment. Confidence is high for a
significant tornado based on rotational velocity continuity, the
favorable mesoscale environment, and a relatively unimpeded warm
sector along the warm front.
..Smith.. 03/03/2019
1st stop, … Storm Prediction Center, … https://www.spc.noaa.gov/ Monitor Convective Outlooks and anticipate where possible Weather Watches may be issued.
2nd step,… National Weather Service Home Page,.. https://www.weather.gov/ Identify where specific Watches, Warnings and Advisories are in effect.
3rd phase, …start paying attention to a presentation of your National Weather Service radar. https://www.weather.gov/Radar. Try to become more familiar with radar options the NWS offers. You will gain confidence at reading the radar as you witness spring storms in your area. Pay attention to what storms get warned on and when. And make a mental note of the storm cells appearance on your local radar.
I have other examples and will revisit this subject again soon.
Wild Bill