All posts by admin

More pictures from the buried western mountains.

March 02, 2019

The view of Half Dome from the Sentinel Dome webcam in Yosemite National Park has been abruptly obscured by the blockbuster storms of early and middle February.

January 22, 2019 … Snow depth in Yosemite National park growing In late January, but the view across the valley remains stunning.

February 07, 2019… Two short weeks later, the snow depth has grown considerably. Only the very top of Half Dome and the distant crest of the Sierra remain visible. 

February 18, 2019…  After a couple of more February storms, no view but a snow bank and blue sky.

March 02, 2019… As recently as Saturday the snow bank remains in place.

Current model runs continue to show an active weather pattern across California and the Sierra for the next week or two. It should be fun to see how much deeper the snow gets before spring melting returns the mighty view to the Sentinel Dome webcam in Yosemite National Park.

Big thanks and shout out to the Yosemite Conservancy.  Photos on this blog retrieved from following websites:

https://rockyags.cr.usgs.gov/dashboards/WebCam.htm

https://www.yosemiteconservancy.org/webcams/half-dome


If you like the blog you will love the book.

Cover2 redo


Parade of storms continues nationwide in early March

Parade of storms continues nationwide in early March

Friday March 01, 2019

Before we can take a breath, relax and look back an incredible February of weather extremes, March is about to roar like a lion.  What is called an Omega ( looks like Greek letter Omega ) Block has been a semi-permanent feature in the Eastern Pacific for weeks now.  I have made the attempt to use blue arrows to show path of cold arctic air and red for the tropical moisture, sometimes called The Pineapple express.  The ridge which makes up the Blocking pattern is not only bring above normal temperatures to Alaska, but notice it also directs  air from the Arctic southward toward the United States including the Pacific Northwest.

Below is the 500mb chart from very early on Friday March 1, 2019

GOES 17 or GOES west IR imaging for midday Friday March 1st shows the next storm lurking west of California.  After impressing central and southern California, this storm will cross the country during the first weekend in the month of March bring a variety of adverse weather pretty much from coast to coast. Another shot of impressive Arctic air will plunge into the central and eastern US following the storm. Early March will look and feel a lot like much of February did for across the nation.

Below I offer one example of what this weather pattern has meant to one of our National Parks. At 6000 feet in the Southern Cascades of Oregon, the south entrance to Crater Lake, the webcam pictures tell quite a story.  First, this year, then last March, and finally the El Niño season of 2016.

The observation from the Anne Springs Entrance shows a snow depth of 129 inches on Friday March 1st.  Up at the rim of the crater the report is 140 inches of snow on the ground.

Last  year on March 1st, 2018,  notice the fallen tree at an angle and compare to picture above.

And finally same view on March 01, 2016, this was the winter of the strong  2015-2016 El Niño.  So this year’s short, weak El Niño has out performed the stronger record event in terms of snow pack at least at this location at this point in the season.

You can learn more in my e-book El Niño:  The WILD side of the weather cycle…
What we know, what we don’t, and WHY you should care!

The book was written for the record 2015-2016 event, but much of the material is also relevant for this year’s much weaker event.

We will review some of this winter’s extreme weather in the coming days. We saw record February snow in several locations, including a brief surprise accumulation in Las Vegas, Nevada. We saw historic rain and flooding across parts of the south and in California. We have also experienced a record cold polar vortex.

So in brief, it has been stormy, it is stormy, and it will continue to be stormy, until the season changes, the arctic air stays in the arctic, and the affect of this current El Niño begins to fade.

If you like the blog you will love the book.

Cover2 redo

Our winter has been influenced by an official El Nino event

An El Niño Advisory has been issued into the spring season. Although much weaker than the record  event 3 years ago,  the most recent ONI number for the months of November, December and January has come in at  “0.8”, this means conditions for El Niño have been met . Three consecutive three month averages have exceeded “0.5”.  So we are officially experiencing an El Nino influenced winter.  The Climate Prediction Center website  provides an abundance of information. Below are the old home site of the Climate Center followed by the specific El Nino page link.

https://www.cpc.ncep.noaa.gov/

https://www.cpc.ncep.noaa.gov/products/precip/CWlink/MJO/enso.shtml

You can also learn more in my  e-book El Niño:  The WILD side of the weather cycle…
What we know, what we don’t, and WHY you should care!

The book was written for the record 2015-2016 event, but much of the material is also relevant for this year’s much weaker event.

We will review some of this winter’s extreme weather in the coming days. We have seen record February snow, including a surprise accumulation in Las Vegas, Nevada. We saw historic rain and flooding across parts of the south and in California. We have also experienced a record cold polar vortex.

If you like the blog you will love the book.

Cover2 redo

Severe weather threat on the horizon.

February 01, 2016

Severe weather threat on the horizon for Tuesday. This is the Storm Prediction Center’s Day 2 outlook for tomorrow, Tuesday February 2, 2016.February 01, 2016day2otlk_0700Sunday’s afternoon highs were plenty warm in the Southern United States to support a bout of spring-like severe storms in the dead of winter.February 01, 2016maximumfor2016Blog - BlogCopy

The jet stream and surface features in almost perfect alignment for severe weather in the SPC’s outlook area. Below are 500mb and surface forecast for 21z Tuesday afternoon.

February 01,2016forcast45hrTuesFeb02Capture -Blog Copy

Now compare the forecast 500mb for later today, 00z February 02, 2016February 01, 2016Bloggfs_namer_024_500_vort_ht

with 12z February 05, 2008, the beginning of the Super Tuesday Outbreak that produced 87 tornadoes over two days killing 56.  The features the two maps have in common would include the event driving deep upper low vicinity Colorado/New Mexico Border, the kicker, just west of the Pacific Northwest, the next disturbance in the series and the polar vortex well north over Hudson’s bay.


February 05, 2008mb500for2016Blog

So, heads up, weather folks are all bent out of shape about this one for a reason. If you do live in the yellow slight risk area, or orange enhanced region there is a real threat for damaging weather with the passage of this weather system.

Southern California wind observations from Sunday January 31, 2016 showing the wind energy of our approaching weather system.

Santa Barbara Island gusting to 79mph.           San Clemente gusting to 56 mph.

January 31, 2016surfsouthcalifornia840pm - Copy

Floods, snowstorms, and tornadoes oddly enough are all in my latest e-book El Niño:  The WILD side of the weather cycle…What we know, what we don’t, and WHY you should care!

I show how this years Pacific water temperatures compare to the 1983 and 1998 events and highlight the kind of weather episodes that these stronger El Niño’s tend to bring.

El Niño at work, increase in cloud over the High Sierra.January 28, 2016milkranch0530pm - Copy

If you like the blog you will love the book.

Cover2 redo

Available at Amazon

Wild Bill.


El Niño winter delivers record snowstorm.

January 28, 2016

Our El Niño winter has delivered an incredible snowstorm to Washington, Baltimore and New York City.

January 24, 2016 snowstorm totals for selected Washington, Baltimore and New York locations.

Location                                    Storm total                                                                 record/storm
DULLES INTERNATIONAL  29.3  1230 AM  1/24  AIRPORT                        32.4 Feb 05, 2010
BWI AIRPORT                          29.2  1230 AM  1/24  AIRPORT                       26.8 Feb 16, 2003

Location                                   Storm total                    calendar day  total      record/day
CENTRAL PARK                     26.8   100 AM  1/24  ASOS                      26.6 / 24.1 Feb 12, 2006 NYC/JFK AIRPORT                 30.5   100 AM  1/24  FAA OBSERVER   30.3 / 21.6 Feb 17, 2003
NEWARK AIRPORT               28.1   100 AM  1/24  FAA OBSERVER  27.5 /  25.9 Dec 26, 1947
NYC/LA GUARDIA                 27.9   100 AM  1/24  FAA OBSERVER  27.9 / 23.3  Feb 12, 2006

There are many different ways to report snow amounts. There are storm totals, calendar day amounts(Midnight to Midnight), and amounts in other 24 periods,(example, daily obs are 12z or 7amEST).  So it can get a little confusing when determining what is an actual record and what is close to a record.

For the Baltimore Airport and most of the New York City area these are indeed record amounts of snow.

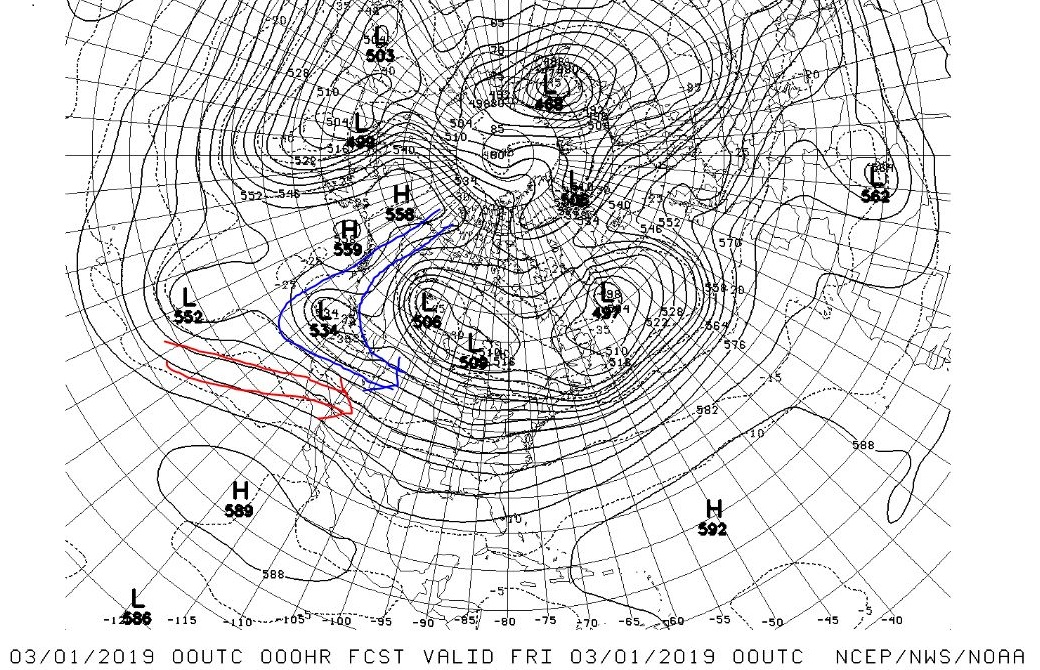
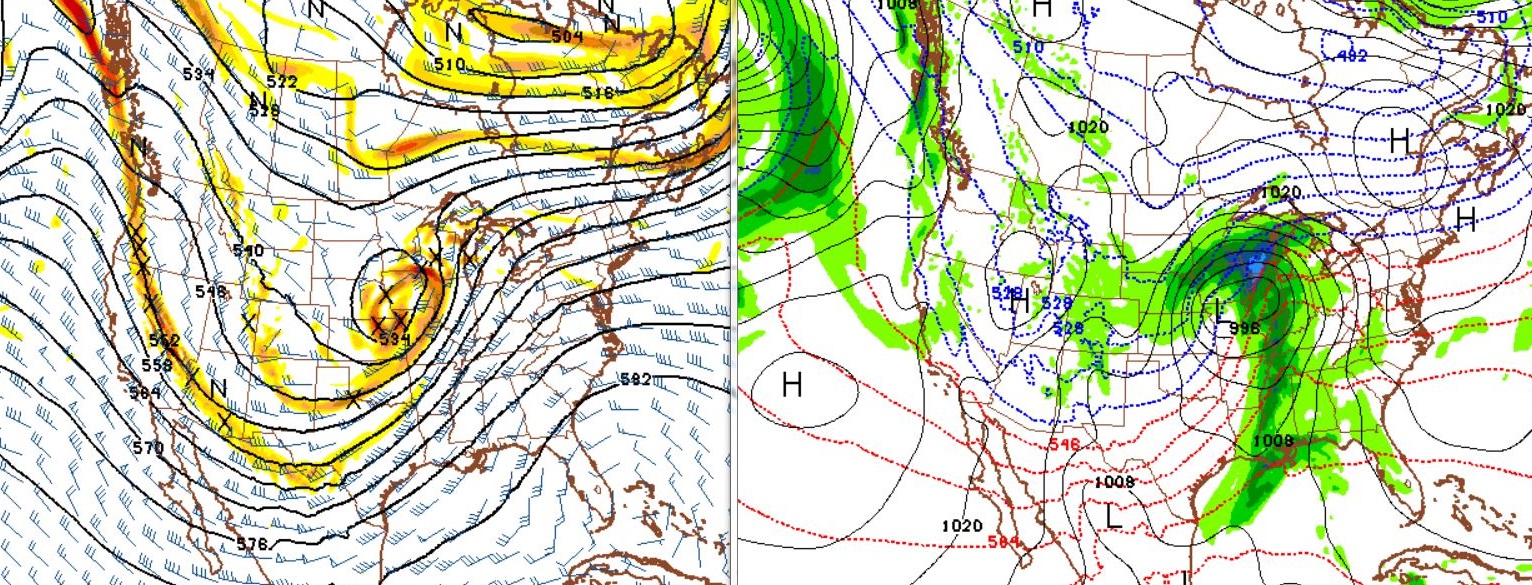
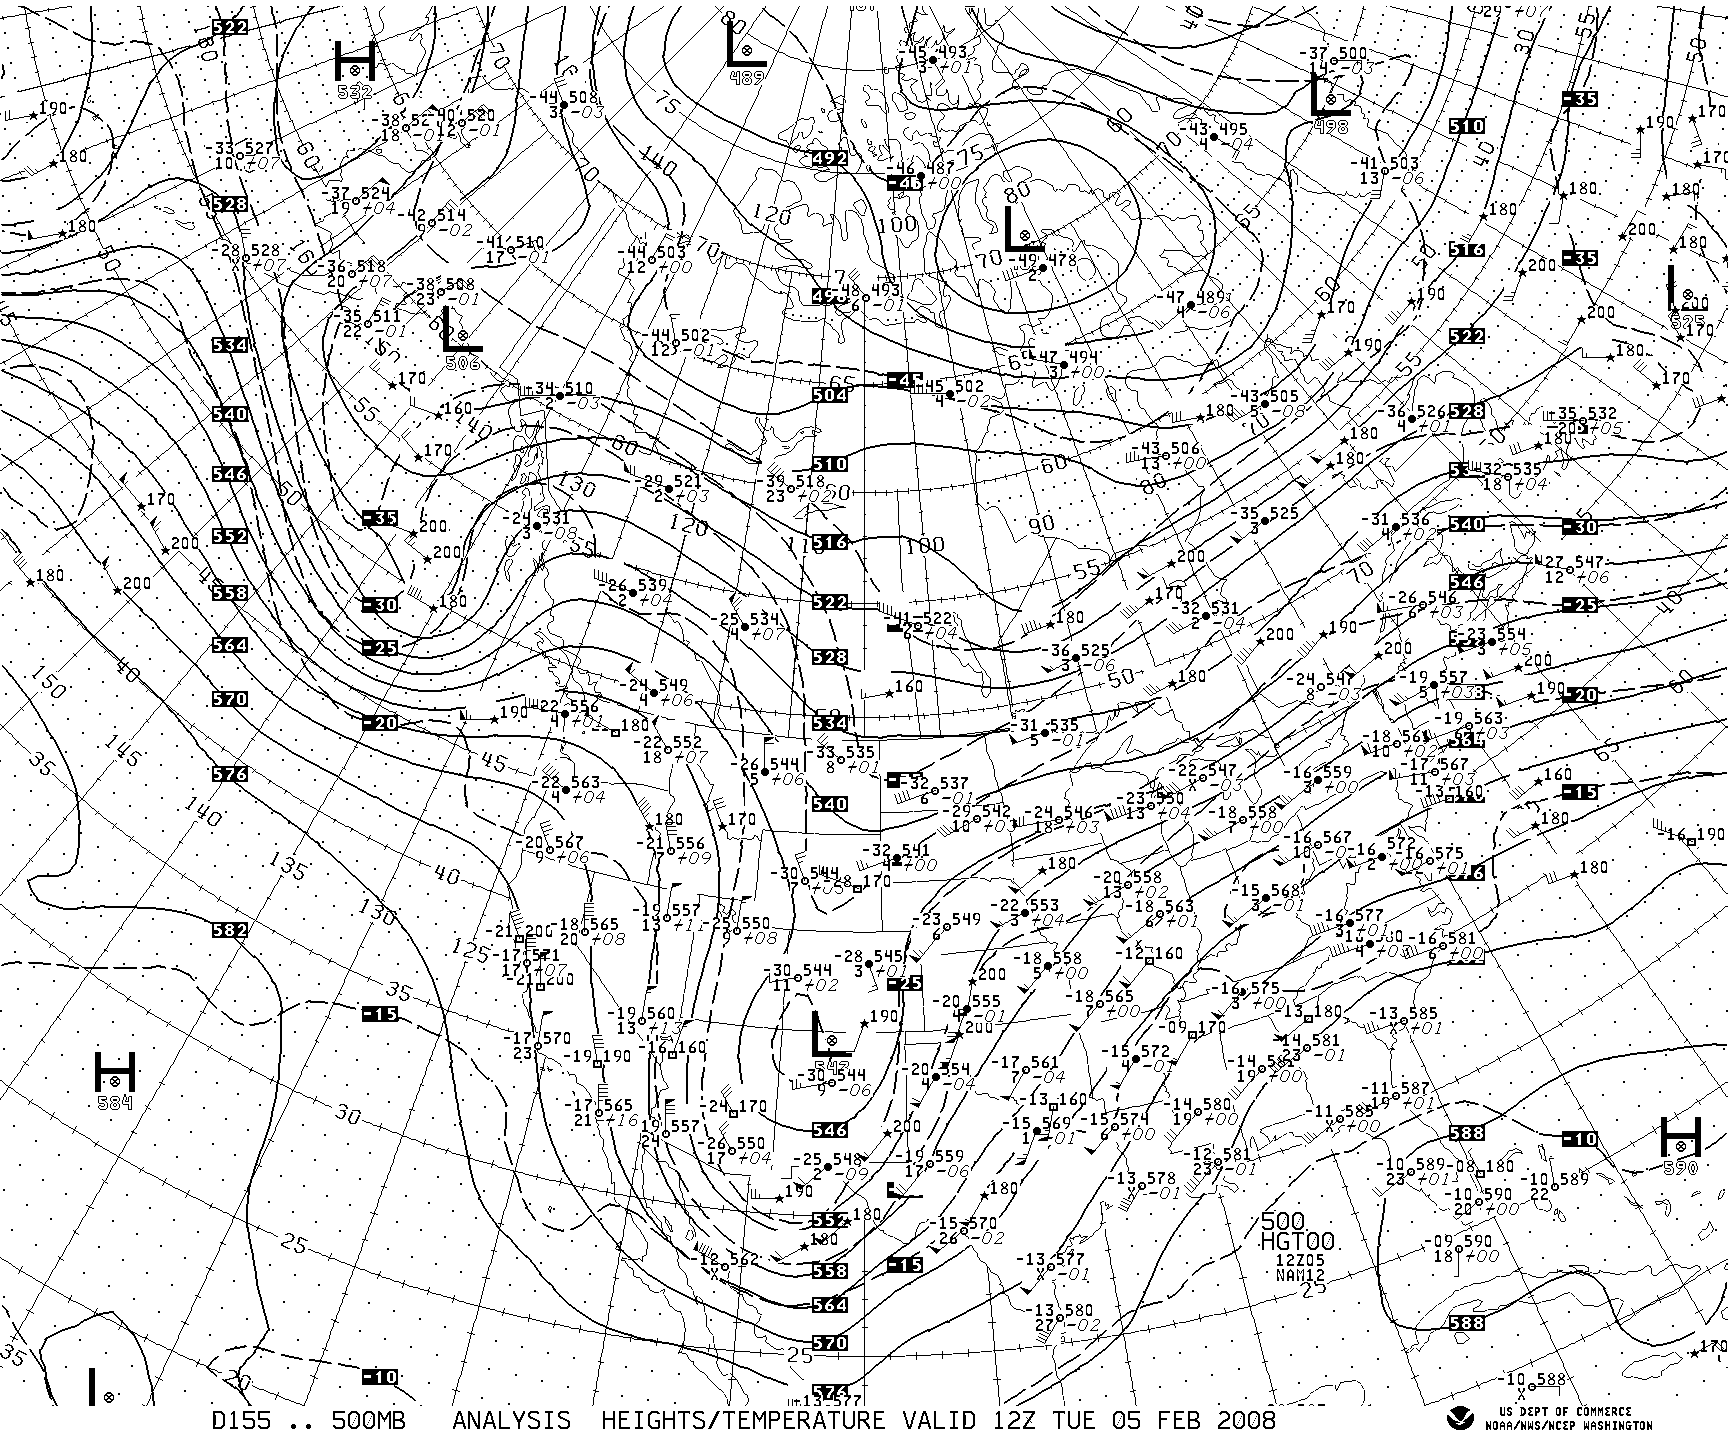
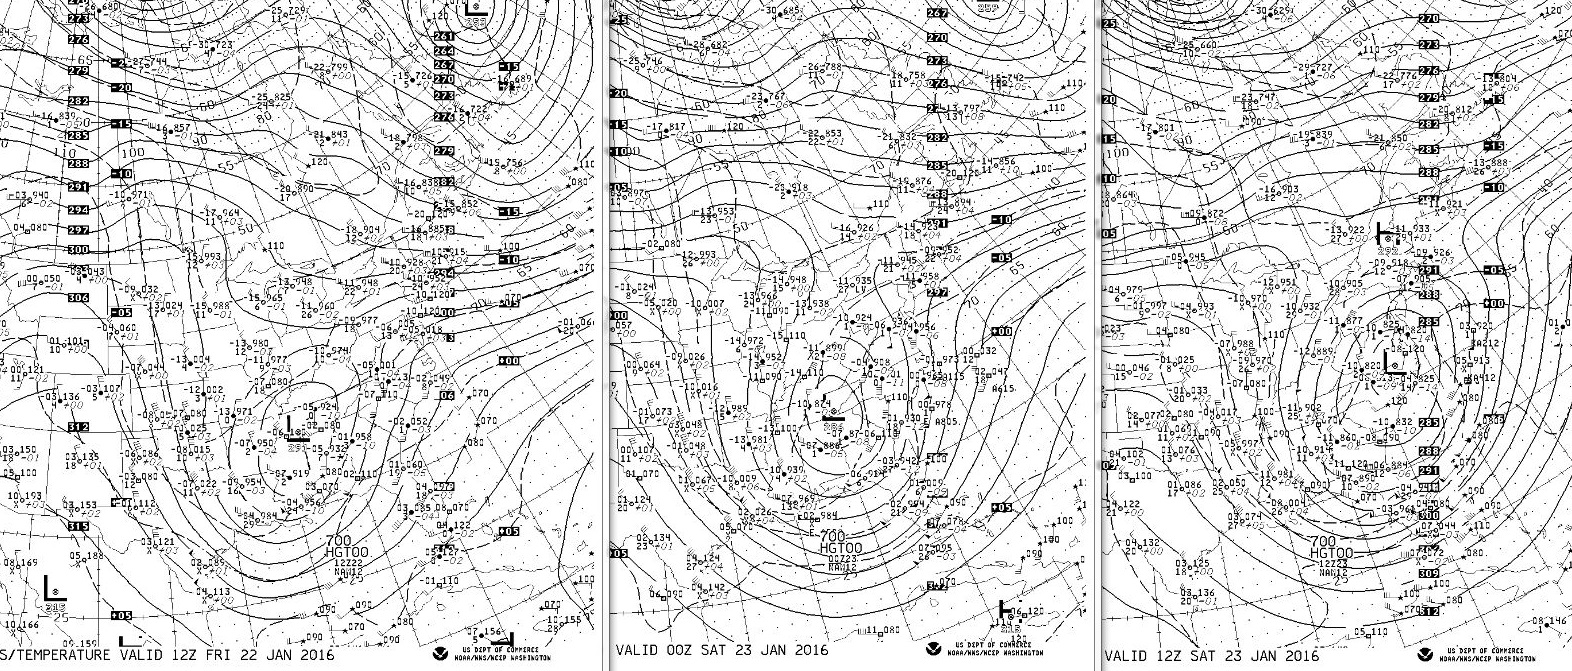
700mb charts below show the storm blossom and slide more east than north focusing the punch at the Mid-Atlantic. However mature circulation does manage to reach as far north as NYC area by Saturday morning the 23rd.

Friday morning 22nd                              Friday evening 22nd                 Saturday morning 23rd

January 23, 2016mb700 NewCopy

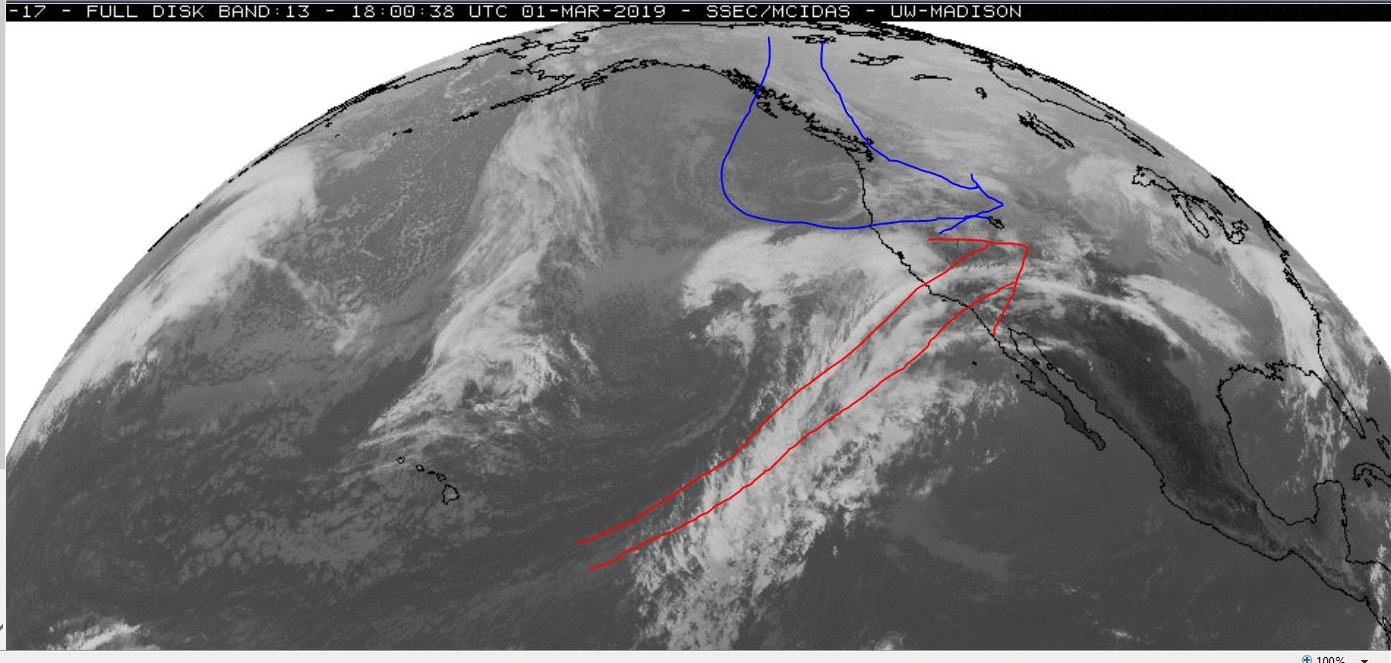
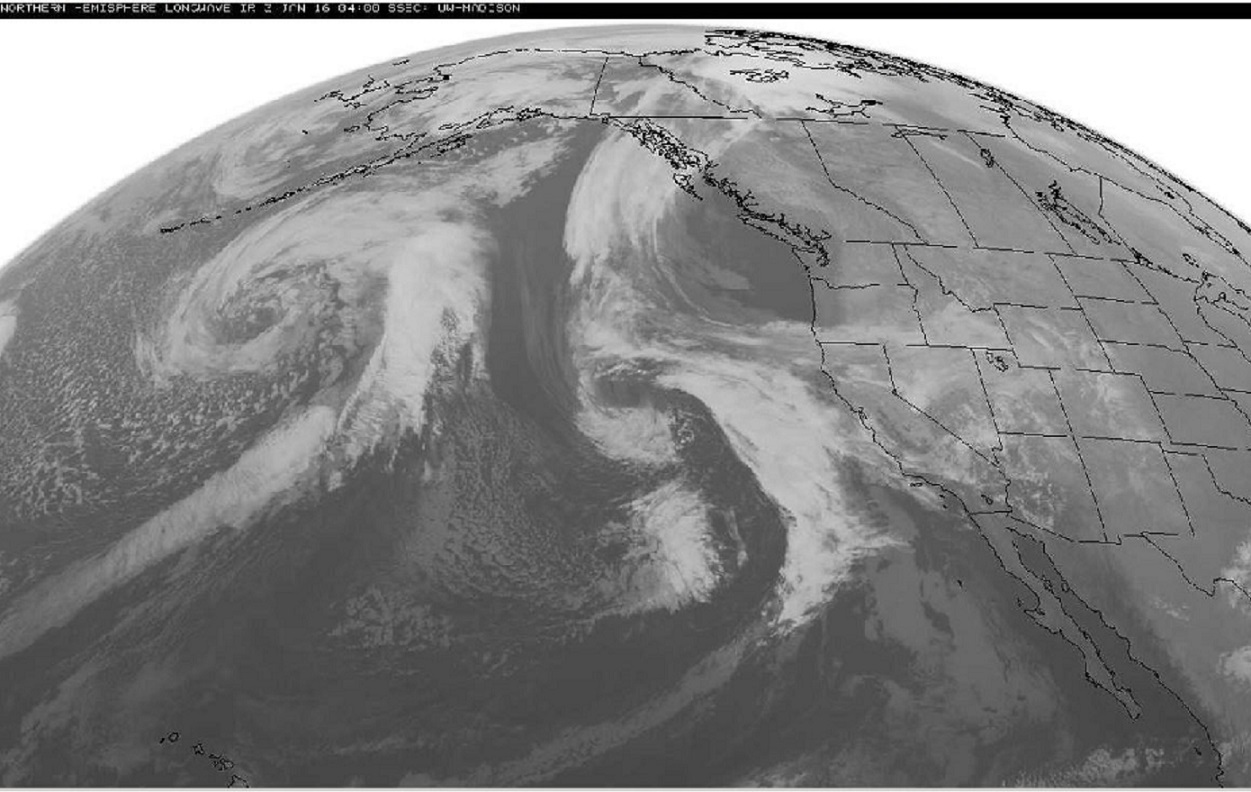
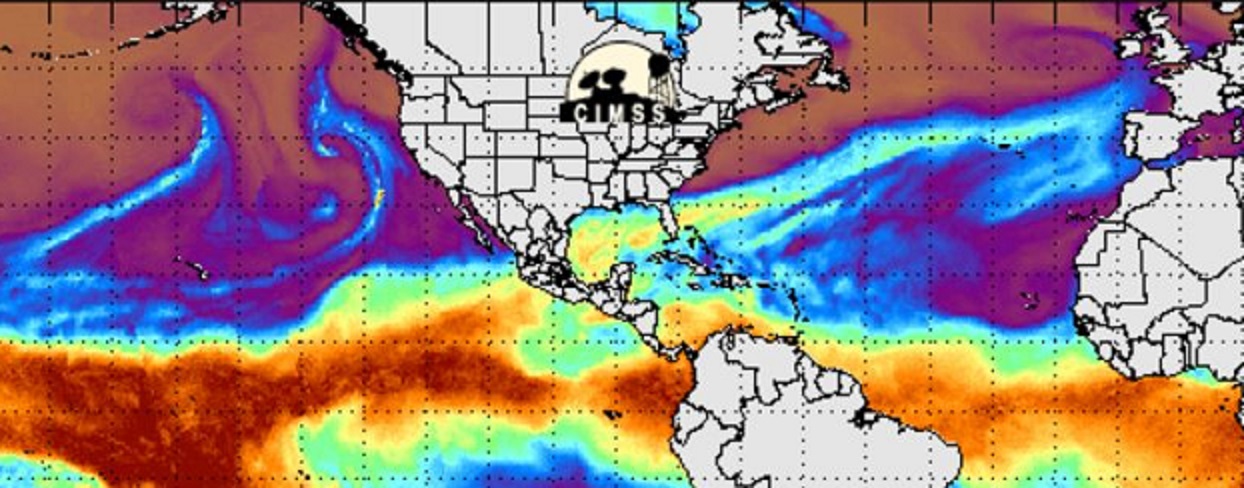
17th, …. 5 days before Blizzard subtropical plume from El Niño region already established.  The plume reaches from the equatorial Pacific across Mexico and the Gulf Of Mexico into Georgia, Florida and the Southeast.January 17, 2016satellitepage0345z - BlogCopy

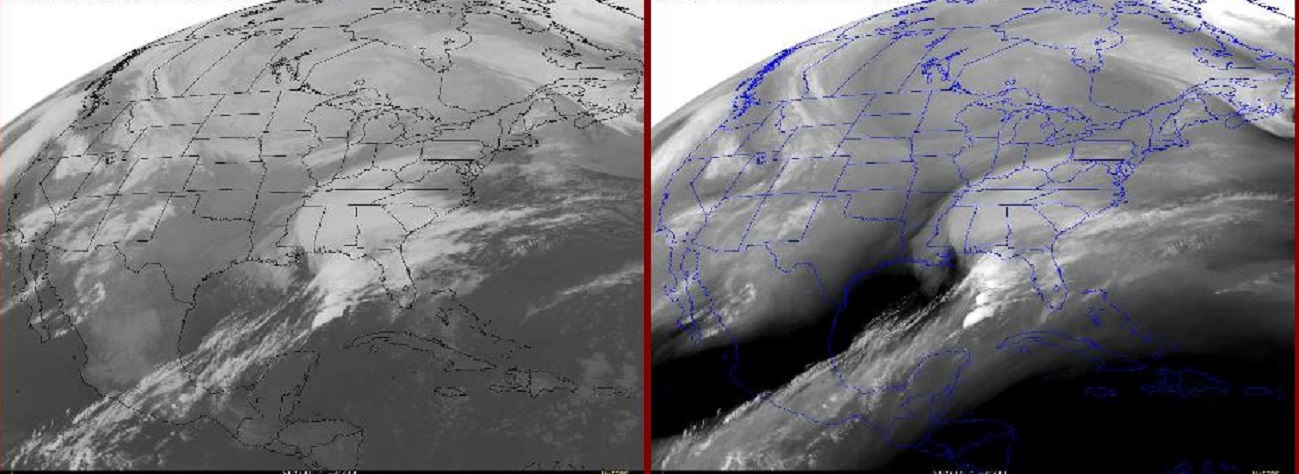
19th, … Disturbance over SE has moved away but the tropical plume remains.January 19, 2016satellitepage0345z - BlogCopy

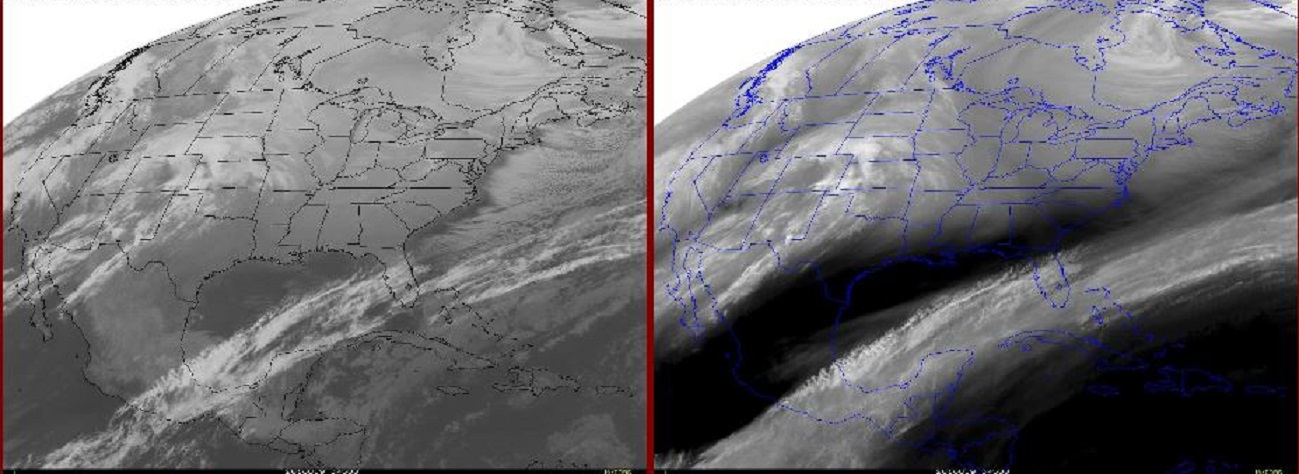
21st, … new disturbance southern plains, tropical plume broadens January 21, 2016satellitepage0645z - BlogCopy

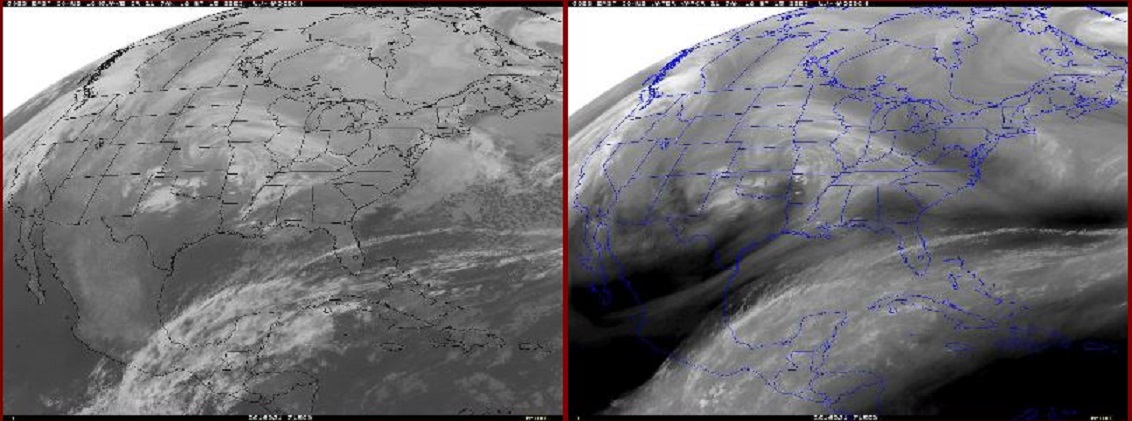
22nd early, … new disturbance gaining strength while approaching but not yet directly connected to the plume.January 22, 2016satellitepage0645z - BlogCopy

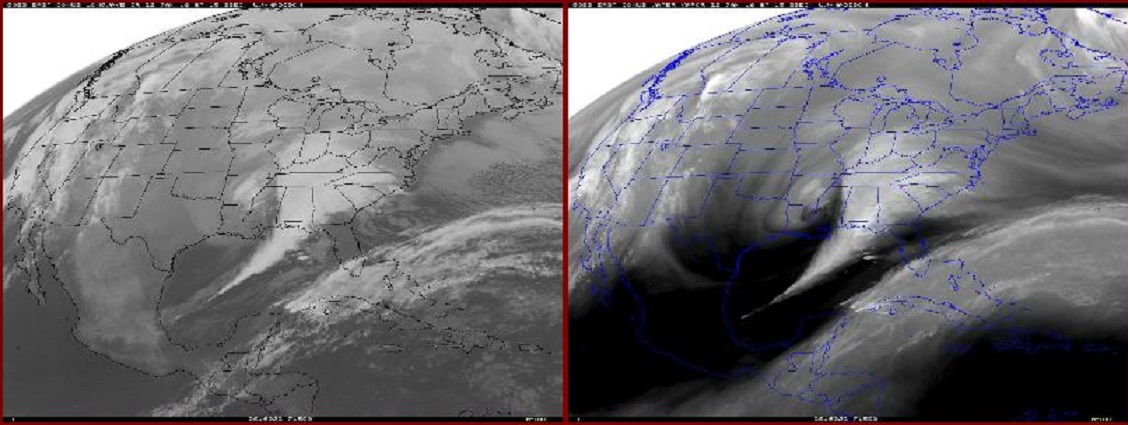
22nd late, …maturing storm system mergers with tropical plume,January 22, 2016satellitepage2215z - BlogCopy

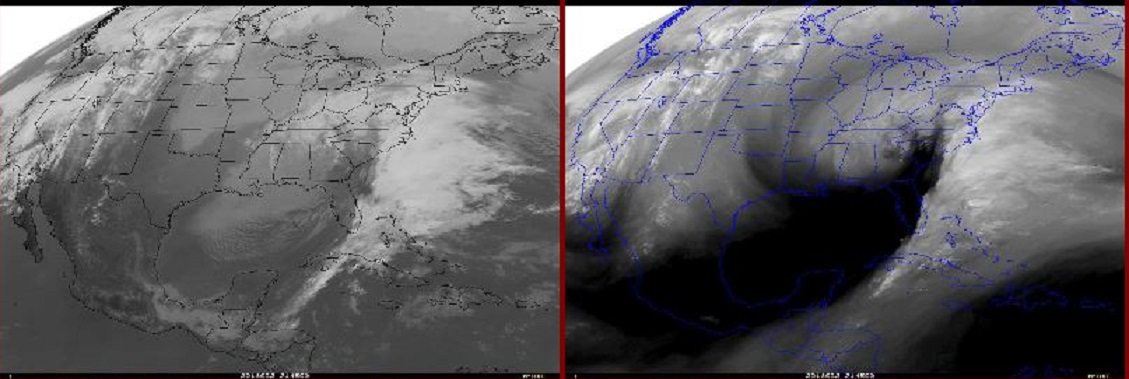
23rd early, … and throws the moisture into below freezing air across Mid-Atlantic.January 23, 2016satellitepage0615z - BlogCopy

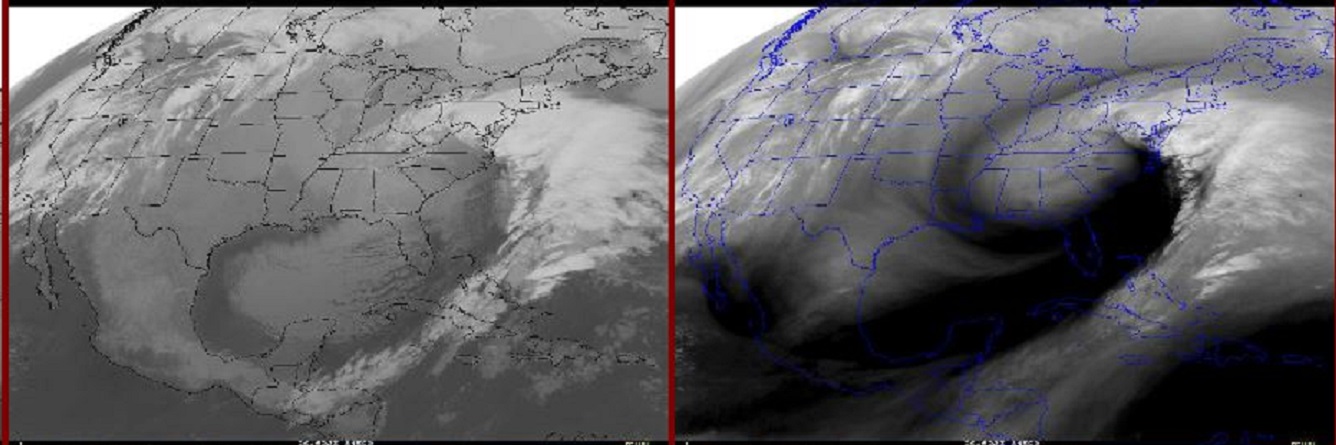
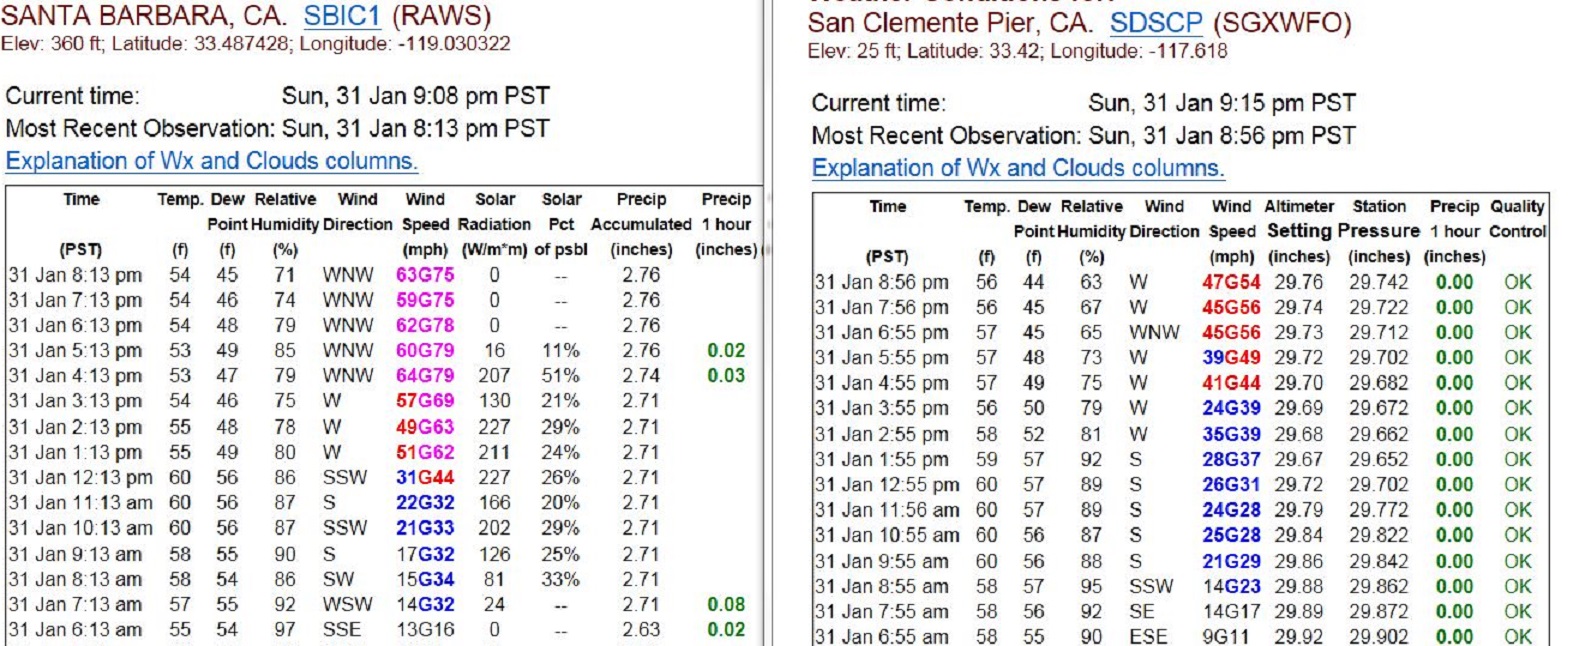
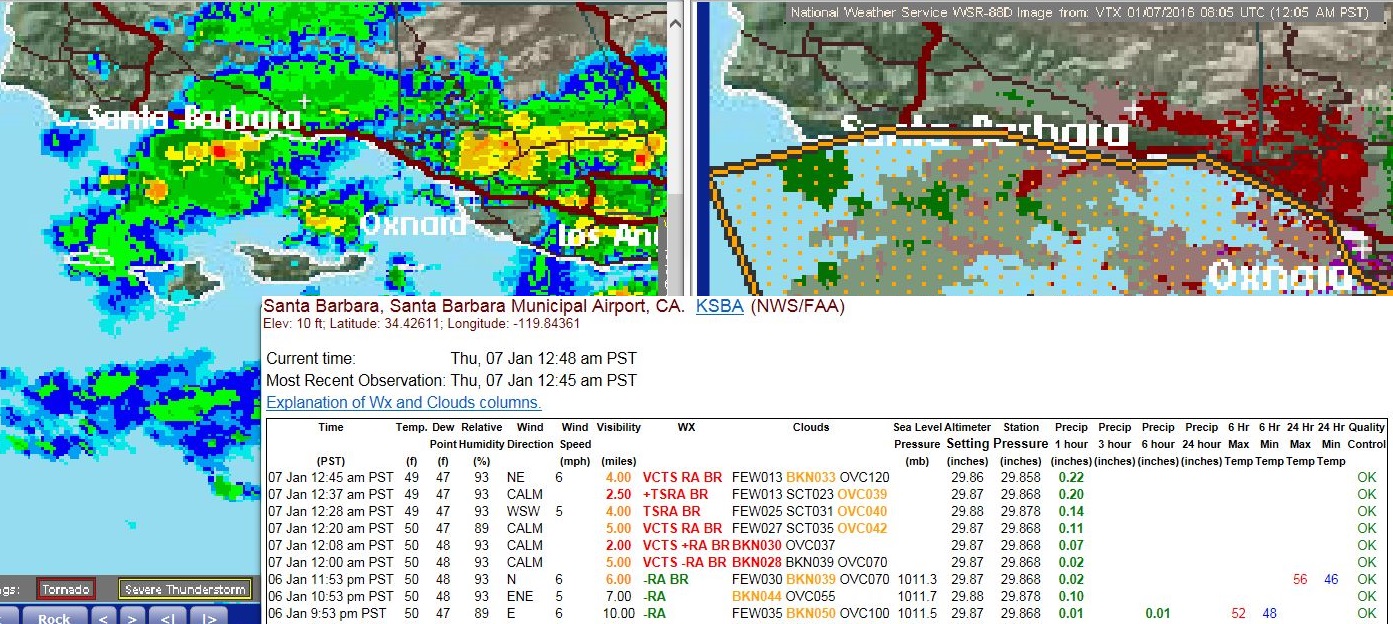
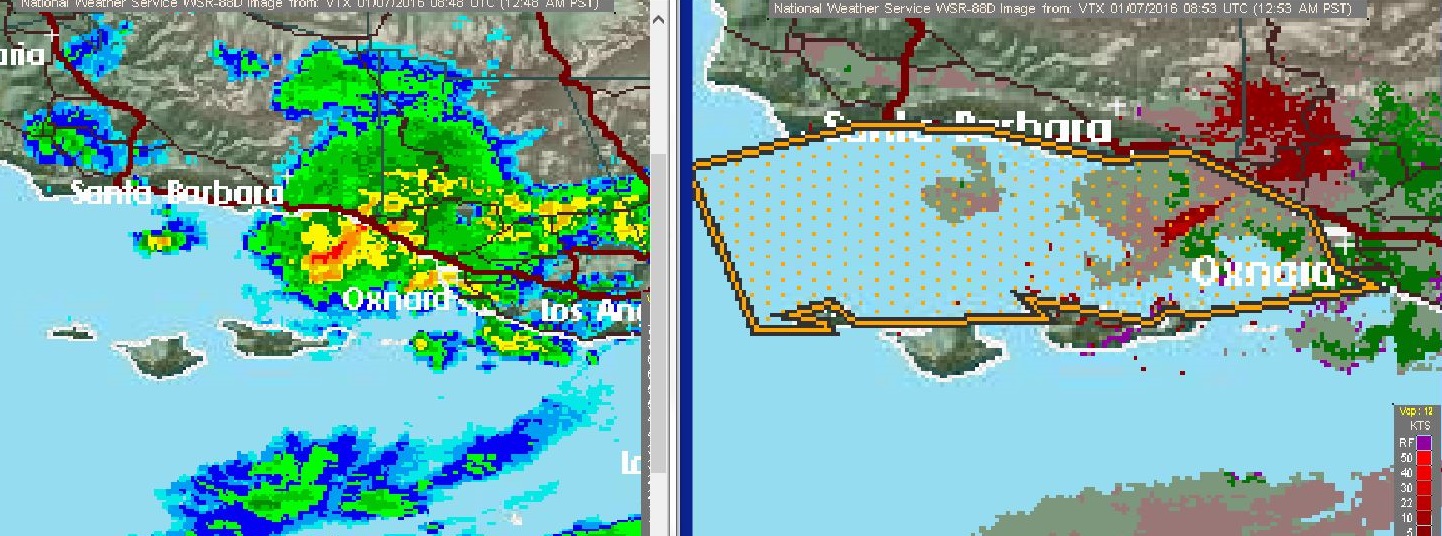
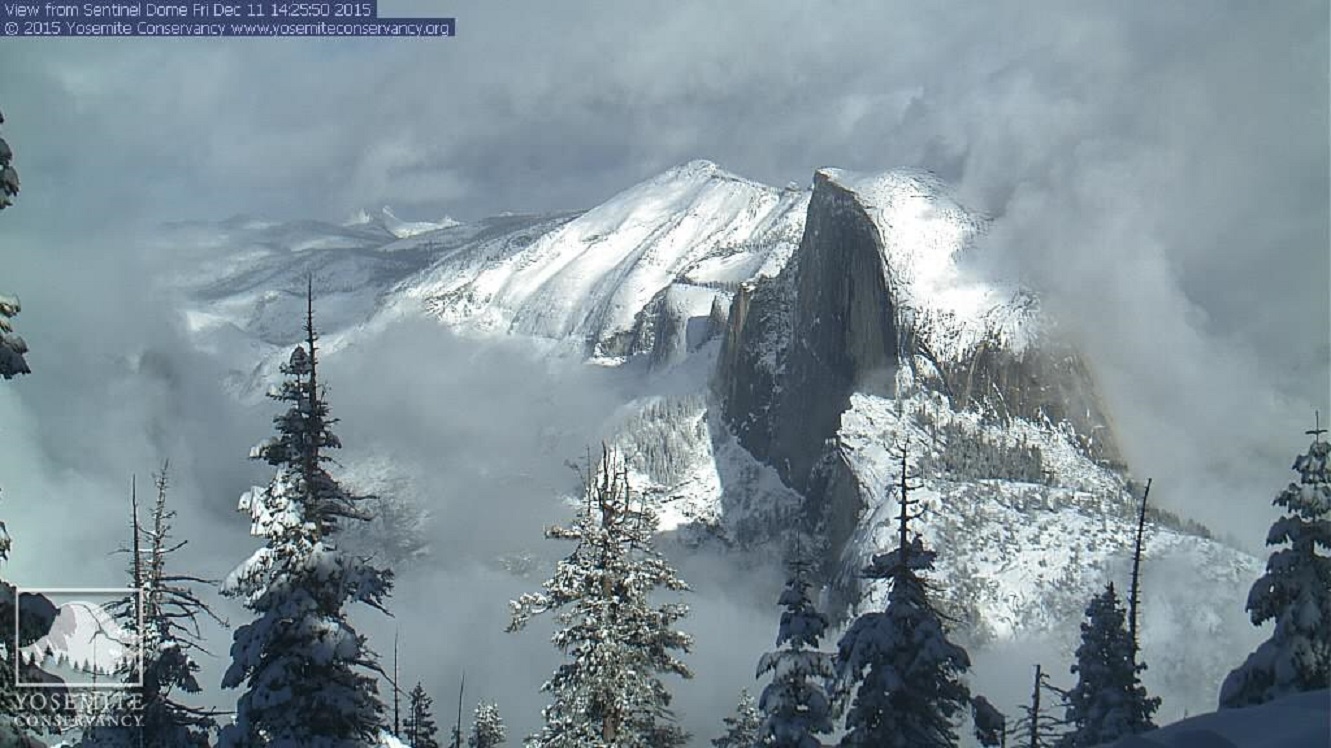
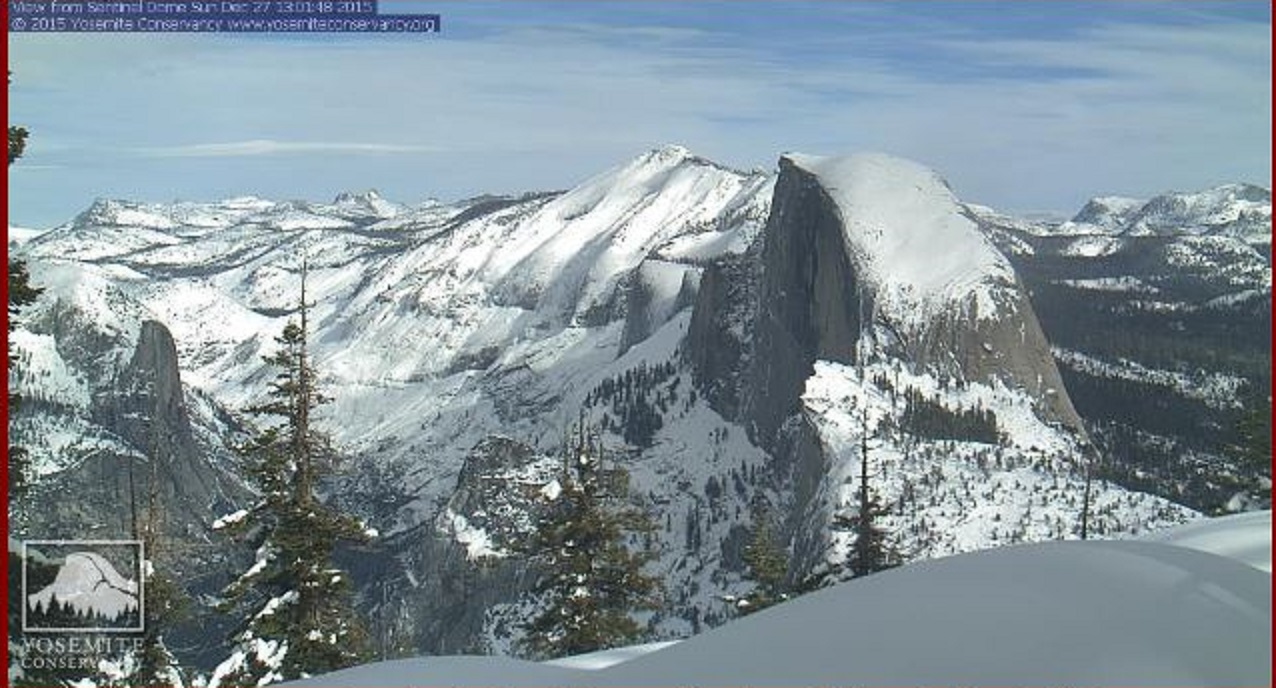
Quite impressive,   impressive enough to challenge all time snowfall records in several major East Coast cities.  Below other El Niño related events in recent weeks, ….

January 08, 2016  Bonnet Carre Spillway to open to divert water out of Mississippi River.

January 09, 2016  CAPE CORAL TORNADO EF-2                                                                                            January 15, 2016   FORT MYERS TORNADO EF-1                                                                                  January 17, 2016   SARASOTA TORNADO EF-2, Fatalities 2                                                                      January 27, 2016   POMPANO BEACH EF-1

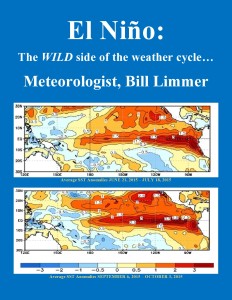
Mississippi River floods, East Coast snowstorms, and Florida tornadoes oddly enough are all in my latest e-book El Niño:  The WILD side of the weather cycle…
What we know, what we don’t, and WHY you should care!

I show how this years Pacific water temperatures compare to the 1982 and 1997 events and highlight the kind of weather episodes that these stronger El Niño’s tend to bring.

If you like the blog you will love the book.

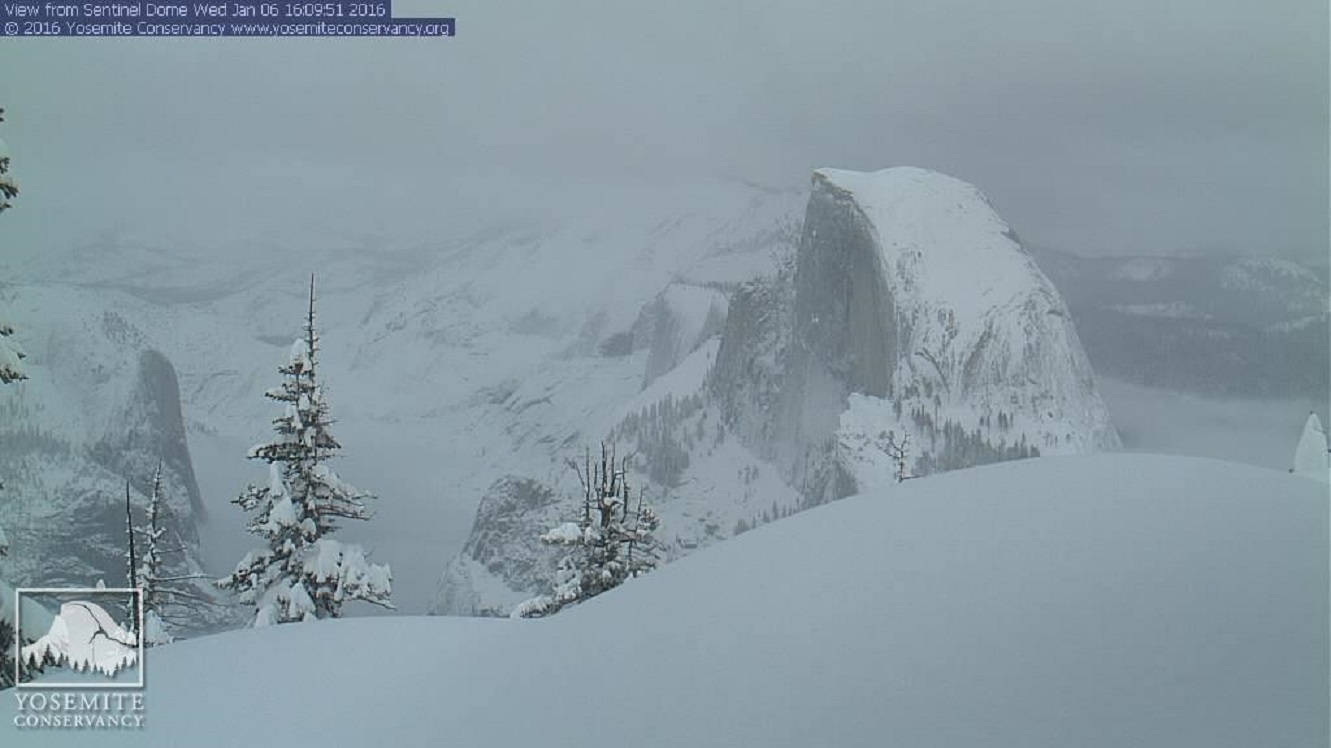
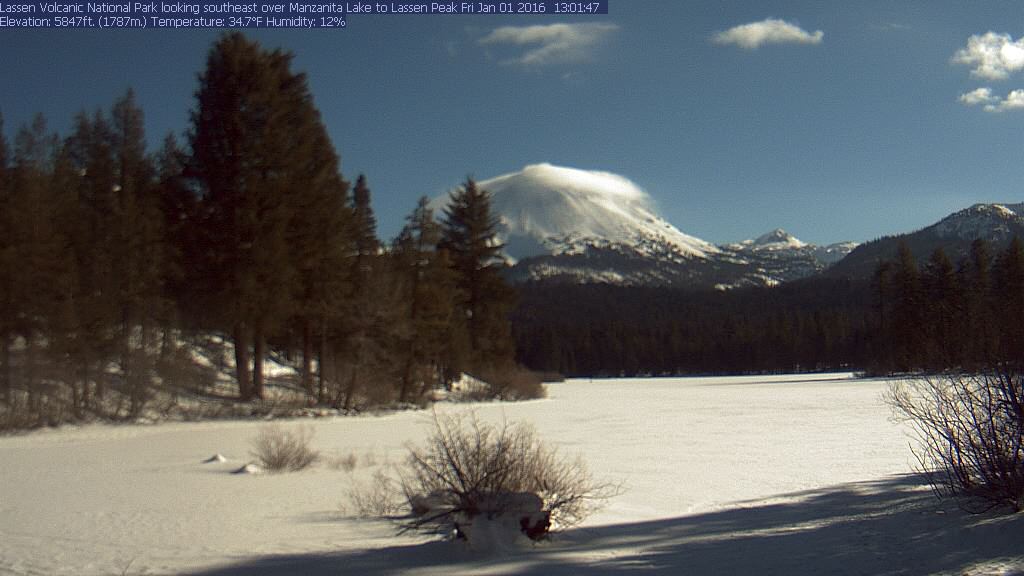
Update on the west coming soon,

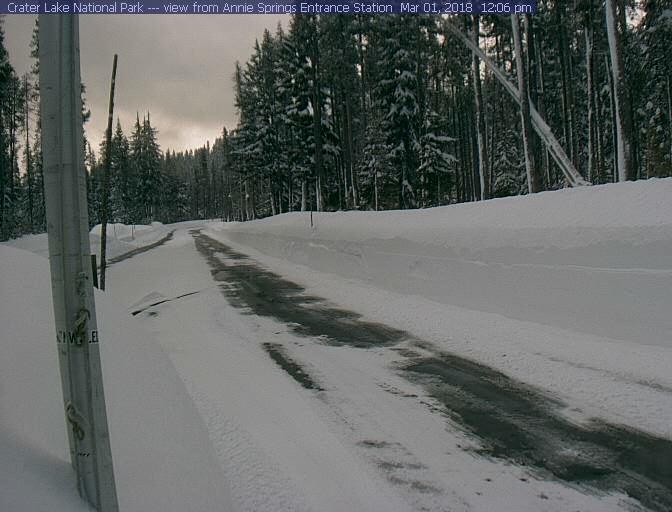
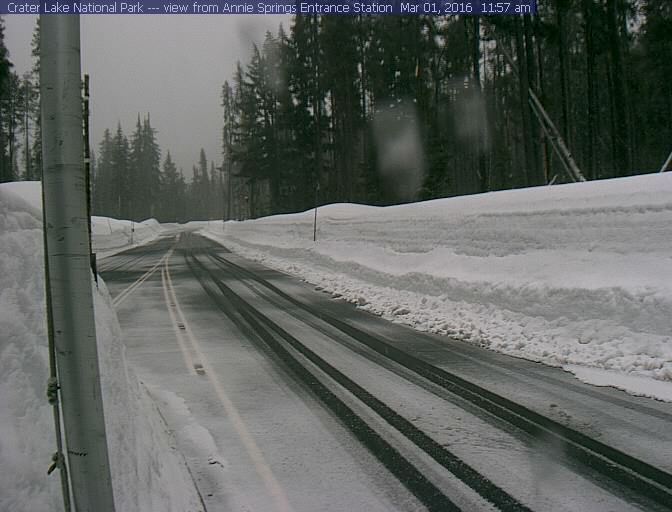
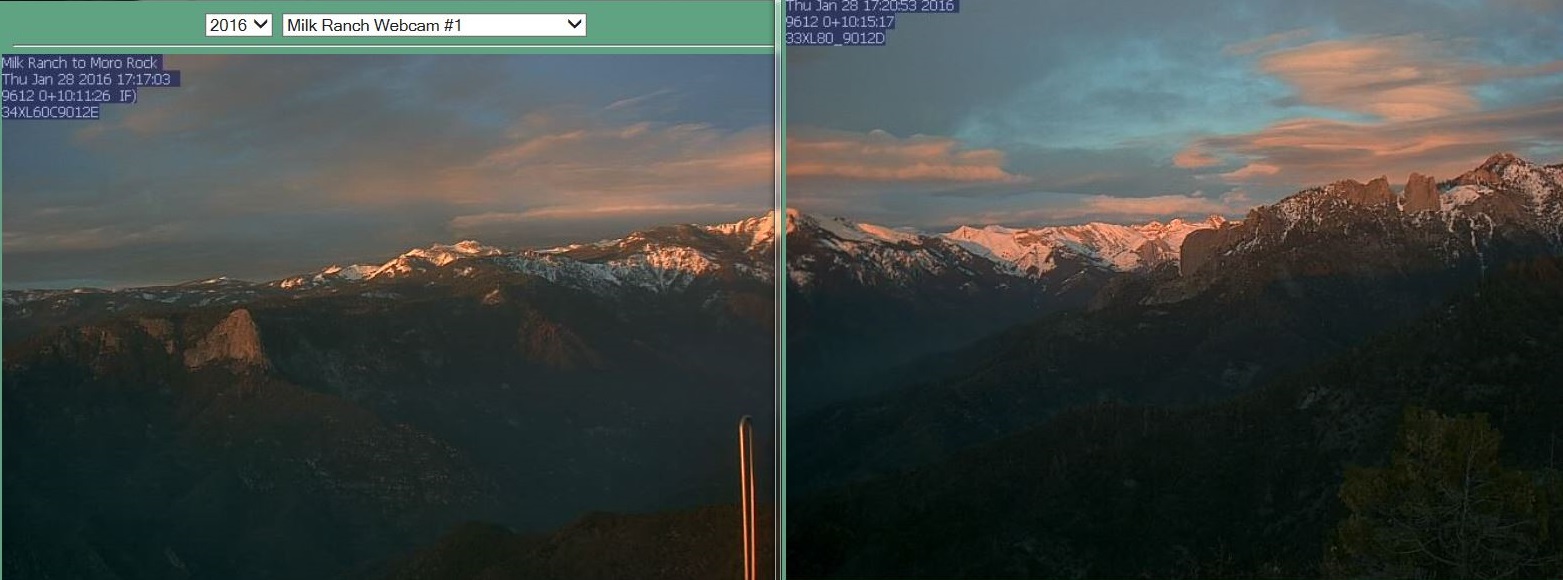
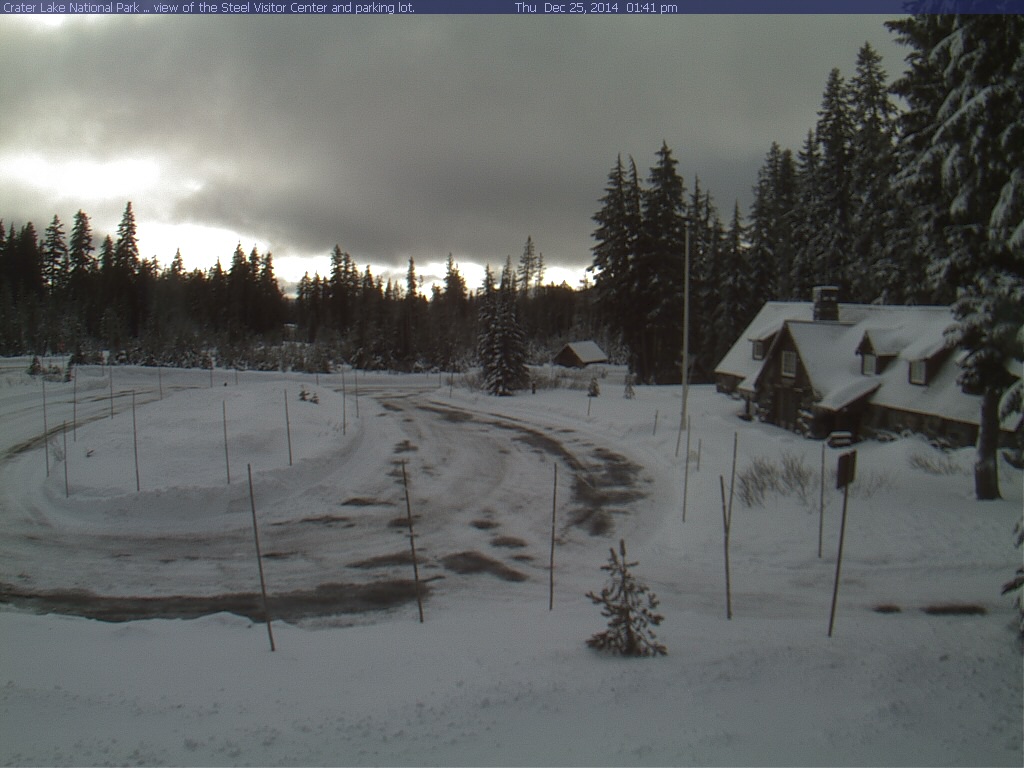
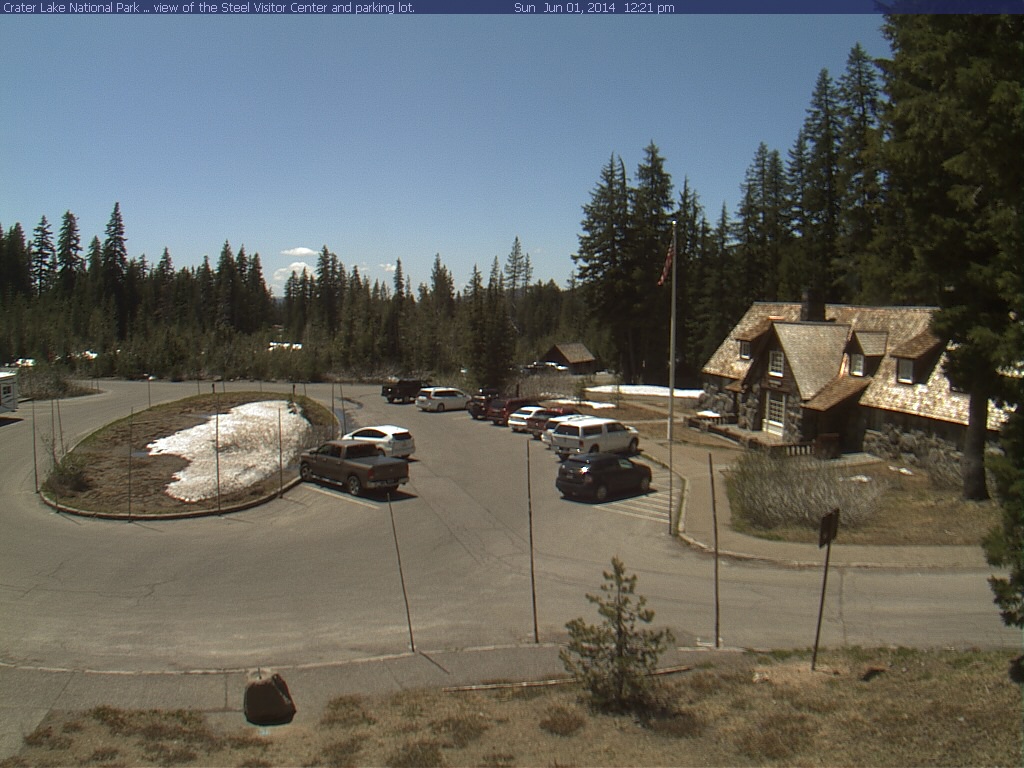
Crater Lake entrance in December:annesprings15-12-07-01

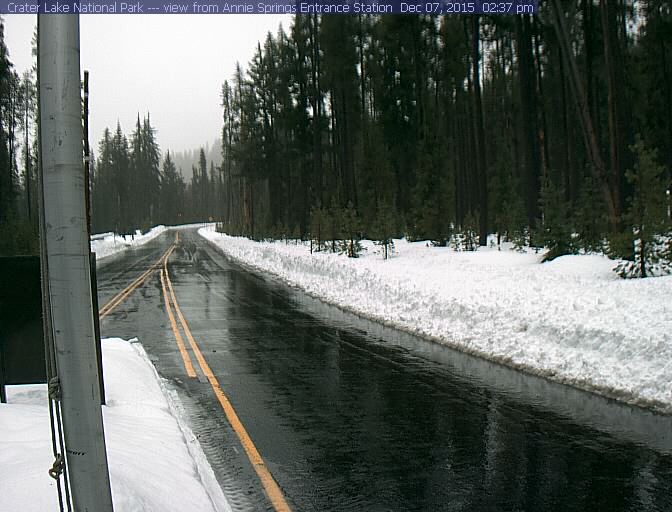
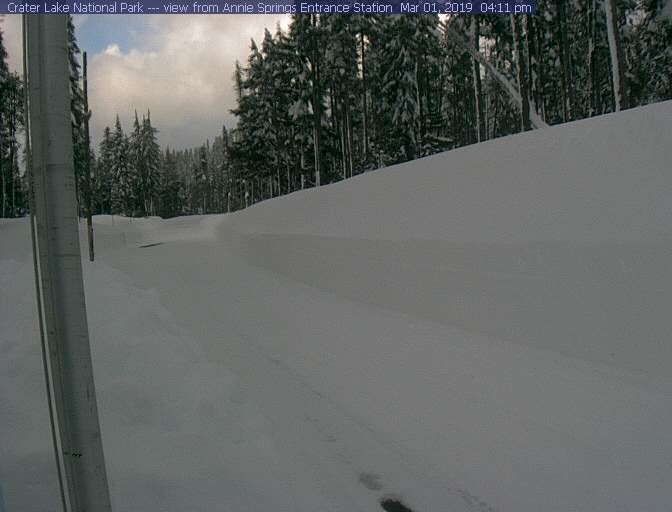
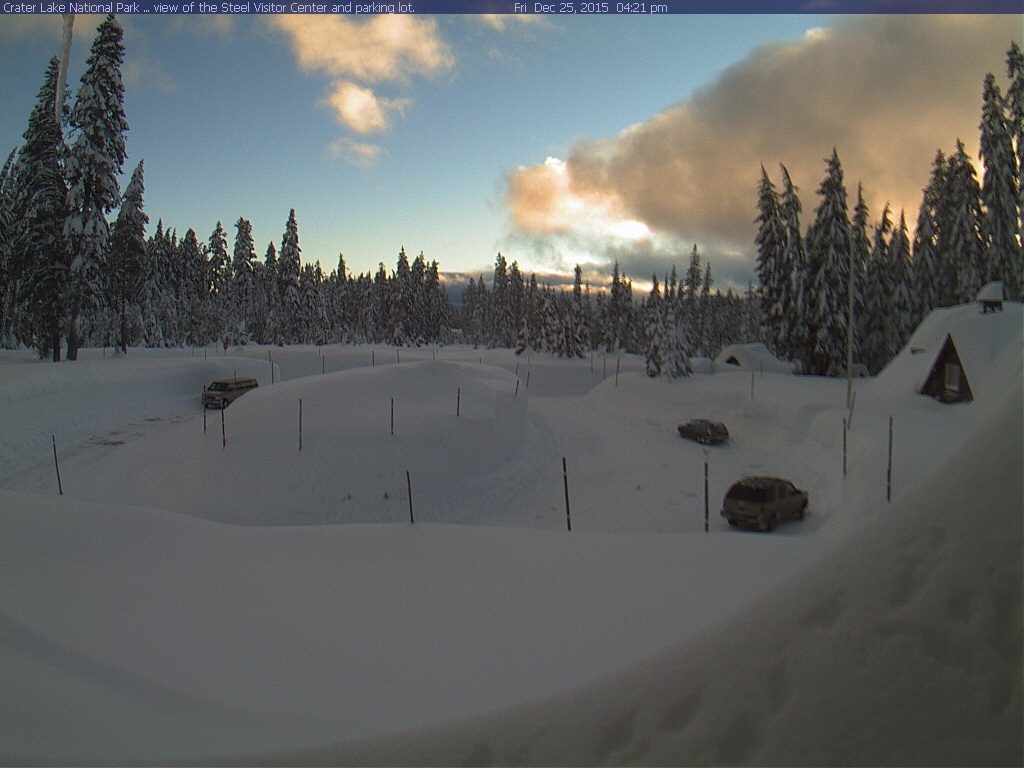
Crater Lake entrance Tuesday January 26,
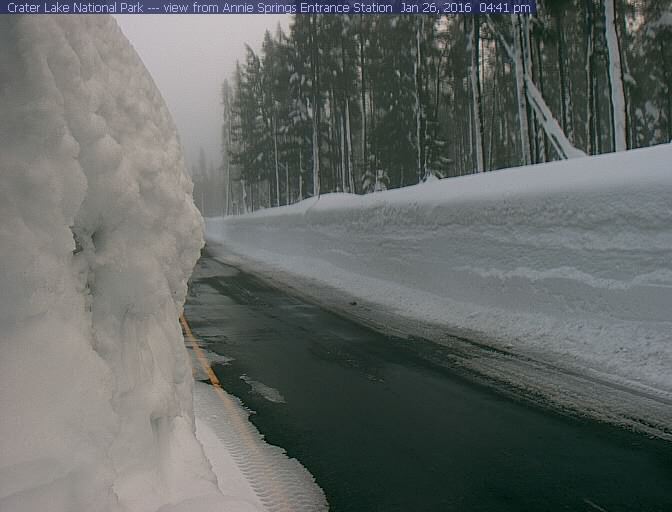
 annesprings16-01-26-01

Cover2 redo

Available at Amazon

Wild Bill.

Thunder, lightning and rotation just off of Santa Barbara.

January 07, 2015

Thunder, lightning and rotation just off of Santa Barbara in the overnight hours.

1208am   Composite Reflectivity                                     and                Storm Relative Motion

January 07, 2016santabarbaracouplet0804z - blog2Copy

1253am   Composite Reflectivity                                     and                Storm Relative Motion

January 07, 2016santabarbaracouplet0848z - Copy

If you like the blog you will love the book.

Cover2 redo

Available at Amazon

Wild Bill.


Another record warm month in the 3.4 Niño region

January 07, 2016

December (12) 2015 is Another record warm month in the 3.4 Niño region.

Warmest monthly SST’s for the 3.4 Niño region
YR   MON   NINO3.4    ANOM
1982  12      29.21    +2.64
1983   1        29.36    +2.79

1997  11     29.32    +2.67
1997  12     29.26    +2.69

2015  10    29.15   +2.46                                                                                                                                     2015  11    29.60  +2.98                                                                                                                                2015  12   29.39   +2.82     

November and December of 2015 achieved the two highest monthly averages for the 3.4 Niño region since 1950 eclipsing the warmest months of both 1997 and  1982.                 

Weekly SST comparison of this season to 1997 for the 3.4 Niño region since July.  First number at months end represent three month or 13 week averages,  Second column is an average of three consecutive sets of 13 week averages.   These values are similar to values in the ERSSTv3b data set for determining the ONI.    

Date             temp  anomaly                          Date             temp  anomaly

01JUL2015       28.9 1.4                                     02JUL1997     29.0 1.5                                     08JUL2015      28.8 1.5                                    09JUL1997     28.9 1.6
15JUL2015      28.9 1.7                                    16JUL1997     29.0 1.8
22JUL2015      28.8 1.6                                    23JUL1997     28.8 1.7
29JUL2015      28.8 1.7   1.246 1.054           30JUL1997     28.9 1.9  1.308

05AUG2015      28.9 1.9                                     06AUG1997     28.8 1.8
12AUG2015      28.9 2.0                                    13AUG1997     28.9 2.0
19AUG2015      28.9 2.1                                    20AUG1997     28.9 2.1
26AUG2015      29.0 2.2   1.631 1.318           27AUG1997     28.8 2.0  1.670  1.254

02SEP2015      28.9 2.1                                     03SEP1997     28.9 2.1
09SEP2015      29.0 2.3                                     10SEP1997     28.9 2.2
16SEP2015      29.0 2.3   1.900 1.592          17SEP1997     28.9 2.2
23SEP2015      29.0 2.3   1.931 1.603          24SEP1997     28.9 2.2  1.931  1.636
30SEP2015      29.1 2.4   1.964 1.614          01OCT1997     29.1 2.4  1.964  1.647

07OCT2015      29.1 2.4                                  08OCT1997     29.2 2.6
14OCT2015      29.1 2.4                                  15OCT1997     29.2 2.5
21OCT2015      29.2 2.5                                  22OCT1997     29.3 2.6
28OCT2015      29.4 2.7   2.277 1.957        29OCT1997     29.2 2.6  2.254  1.963

04NOV2015      29.5 2.8                                  05NOV1997     29.2 2.6
11NOV2015      29.7 3.0                                  12NOV1997     29.3 2.7
18NOV2015      29.7 3.1                                  19NOV1997     29.3 2.7
25NOV2015      29.6 3.0   2.562 2.268       26NOV1997     29.4 2.8  2.477  2.231

02DEC2015      29.5 2.9                                  03DEC1997     29.2 2.6
09DEC2015      29.4 2.8                                  10DEC1997     29.2 2.7                                                       16DEC2015       29.5 2.9                                   17DEC1997     29.3 2.7
23DEC2015      29.3 2.7                                  24DEC1997     29.3 2.7
30DEC2015      29.3 2.7   2.762  2.534       31DEC1997     29.2 2.7  2.654   2.462

Evidence of El Niño at work  in the Sierra Nevada.

December 11, 2015Halfdome15-12-11-05 - Copy

December 27, 2015December 27, 2015yosemite -blog Copy

January 06, 2016Halfdome16-01-06-02 - Copy

We may have just seen the first major storm in Southern California, but it has been snowing in the Cascades and Sierra Nevada for weeks now. Visible evidence  shows snow depths increasing above Yosemite Valley.


Learn more in my latest e-book El Niño:  The WILD side of the weather cycle…
What we know, what we don’t, and WHY you should care!

I show how this years Pacific water temperatures compare to the 1982 and 1997 events and highlight the kind of weather episodes that these stronger El Niño’s tend to bring.

If you like the blog you will love the book.

Cover2 redo

Available at Amazon

Wild Bill.

Stormy period for Southern California

January 03, 2016

Pictured in this late evening satellite image is the first two of perhaps four separate waves of moisture that will pass through South California between Monday and Friday.  The waves, or periods of stormy weather will be Southern California’s first widespread significant rain of this El Niño  season.

January 03, 2016Blogwestcoast0300z Closeup

Another image showing atmospheric moisture content also shows two narrow bands of tropical moisture feeding up from equatorial regions into the approaching storms. Also notice the fat ribbon of moisture from the Gulf of Mexico to Europe. While the U.S. endured record warmth, tornadoes and flooding for the Holidays, The British Isles were swamped by stormy weather as well. All signs El Niño continues to have a major influence on  weather Worldwide.January 03, 2016BlogMorphed0300z - Close

One last image to try and answer the question of why the Mighty Mississippi is in flood in January. The dark red over Central Missouri indicates up to 10 inches of rain over a 300 mile stretch from St. Louis to Joplin. Most of that rain occurring in the last seven days.

December 30, 2015rainfall14day - Copy

In coming days we will look at January’s cold turn in the East where record warmth ruled the Christmas Holiday.

Below, a cloud covers the summit of Mt. Lassen on the 1st day of the year.Lassen Peak16-01-01-01

Learn more in my latest e-book El Niño:  The WILD side of the weather cycle…
What we know, what we don’t, and WHY you should care!

I show how this years Pacific water temperatures compare to the 1982 and 1997 events and highlight the kind of weather episodes that these stronger El Niño’s tend to bring.

If you like the blog you will love the book.

Cover2 redo

Available at Amazon

Wild Bill.

Finally some rain for Southern California

December 30, 2015

Finally some rain may be in the forecast for Southern California. After a record warm Christmas in New York, historic flooding in Missouri, deadly winter tornadoes, and a healthy snowfall in El Paso, it may finally rain in Los Angeles. The warm Christmas in NYC, the flooding in Missouri,  and the Christmas week snow in El Paso all happened in the last  few days AND are all repeats of events in December 1982.

Parts of The Cascades are buried, 9 feet around Crater Lake. The Lake Tahoe area has seen feet of snow in recent weeks as has portions of the Northern and Central Sierra. The last piece of the puzzle is Southern California rain.

Finally some rain may be in the forecast for Southern California. Two distinct short waves approach Southern California Sunday and Tuesday of the upcoming week.

Forecast 500mb flow for midday Sunday January 03, 2016.

December 30, 2015Bloggfs_namer_114_1000_500_thick

Forecast 500mb flow for midday Tuesday January 05, 2016.

December 30, 2015Bloggfs_namer_162_1000_500_thick


Learn more in my latest e-book El Niño:  The WILD side of the weather cycle…
What we know, what we don’t, and WHY you should care!

I show how this years Pacific water temperatures compare to the 1982 and 1997 events and highlight the kind of weather episodes that these stronger El Niño’s tend to bring.

If you like the blog you will love the book.

Cover2 redo

Available at Amazon

Wild Bill.

Contrast highlights Holiday weather across the nation

December 28, 2015

Not just a warm Holiday for some in the East, but a record warm Christmas Holiday. This is just a sample of the hundreds of record high temperatures that have been set across the eastern half of the nation in recent weeks. Some locations like New York’s Central Park set a high temperature record on both Christmas Eve and Christmas Day.  Albany New York was 15 degrees warmer than any other Christmas Eve on record and Burlington Vermont was 17 degrees warmer than the previous record. In places like  Vermont, where a White Christmas is expected, temperatures nearly 40 degrees above normal are not only noticeable but crippling to the ski and winter industries. Ice and snow just don’t hold up to temps in the 60s and lower 70s.

December 24, 2015 Record Highs Christmas Eve

Central Park NYC          72R  1131 AM  63    1996
Albany ALB                      72R    220 PM  57    1941
Boston BOS                     69R    359 PM  61    1996
Hartford BDL                  69R    259 PM  59    1996
Providence PVD            69R    404 PM  64    2014
Burlington BTV              68R    154 PM  51    1957

December 25, 2015 Record Highs Christmas Day

Central Park NYC                   66R  1231 AM  64    1982
John F. Kennedy JFK           64R    256 PM  58    1982
Providence PVD                     64R    228 PM  63    2014
Worchester ORH                    60Rt  153 PM  60    1964

Philadelphia PHL                  68Rt   225 PM  68    1964
Washington Dulles IAD          70    215 PM  71    1982

Atlanta ATL                            75R      452 PM  72    1987
Athens AHN                           77Rt     254 PM  77    1982

The unusually warm weather not only set records, but also set the stage for several rounds of deadly severe weather.  Several fatalities occurred across Mississippi and Tennessee from a long track EF-3 tornado on Wednesday the 23rd. An EF-2 tornado struck a Birmingham suburb on Christmas Day. Damage was significant but no fatalities occurred.  A new storm system on the 26th was still able to take advantage of the unusually warm weather.  An EF-4 steamrolled the Dallas suburb of Garland killing eight in the early evening hours.

Brief review of Holiday severe weather:

December 23, 2015, …10 fatalities were reported in Mississippi, six were killed in Tennessee. One tornado producing thunderstorm tracked 145 miles from the Mississippi River across the state and into Tennessee killing 7. Other fatalities occurred due to tornadoes, straight-lines winds and flooding.

December 25, 2015, … EF-2 tornado swirled across portions of McCalla and Bessemer Alabama, immediate suburbs of Birmingham, collapsing houses but not killing anyone.

December 26, 2015, …11 died in Texas after several tornadoes were reported in the Dallas area.  In Garland, a suburb of Dallas, eight people died Saturday from an EF-4 tornado, three others died in Collin County just to the north.

In contrast,  the Cascades of Oregon looked quite wintry on the Holiday. Below are images from last Christmas, this Christmas and June 1st.

The Steel Visitors Center Crater at Lake National Park on Christmas Day 2014.steelvisitorcenter 14-12-25-1

The Steel Visitors Center Crater at Lake National Park on Christmas Day 2015.

At 7050 feet the snow depth listed for Christmas Day 2015 was 111 inches, or a little over 9 feet. That is a full size van parked back left and the snow banks are well above.steelvisitorcenter15-12-25-03

The Steel Visitors Center Crater at Lake National Park on June 01, 2014.                                 Even in a drought year the snow cover lingers until June.steelvisitorcenter 14-06-01-1

Just to show anyway you look at it,  Crater Lake was buried for this Holiday.  A series of West Coast storms have left there mark on the mountains of the West.


Learn more in my latest e-book El Niño:  The WILD side of the weather cycle…
What we know, what we don’t, and WHY you should care!

I show how this years Pacific water temperatures compare to the 1982 and 1997 events and highlight the kind of weather episodes that these stronger El Niño’s tend to bring.

Central Park NYC                   66R  1231 AM  64    1982

If you like the blog you will love the book.

Cover2 redo

Available at Amazon

Wild Bill.