November 03, 2015
A sign of the changing season as well as a sign that rare moisture is beginning to arrive in the still parched Sierra Nevada. First picture at 11:23 am looks foggy but look closely and you can see the snowflakes against the gray sky.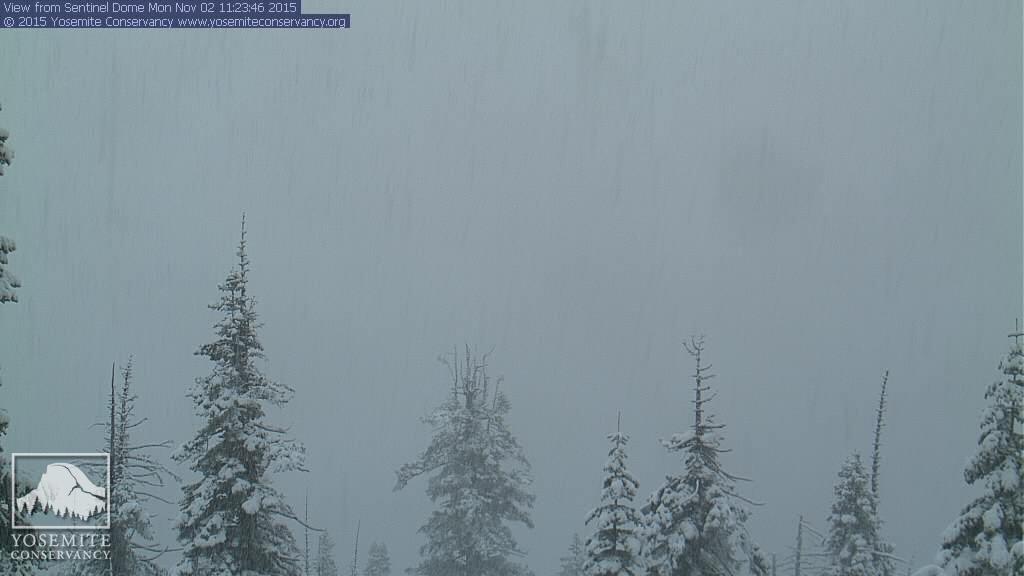
The next picture looks like 2:43pm, over three hours later, and you can see the accumulation on the conifers.
Thanks to the Yosemite Conservancy for their many windows into this extraordinary park. This is the sentinel dome view with a camera elevation near 7500 feet.
The weekly sea surface temperature anomalies in the 3.4 Niño region of the Pacific continue to be impressive, especially when compared to 1997. The most recent reading of +2.7 is the warmest weekly value since December 1997, when that event was near its peak. October weekly values averaging +2.5 will most certainly have an effect on the more complex three month running average.
07OCT2015 29.1 +2.4 08OCT1997 29.2 +2.6
14OCT2015 29.1 +2.4 15OCT1997 29.2 +2.5
21OCT2015 29.2 +2.5 22OCT1997 29.3 +2.6
28OCT2015 29.4 + 2.7 29OCT1997 29.2 +2.6
average 2.50 average 2.58
Below the most recent posting from the Climate Prediction center and the weekly expert discussion. Weekly numbers for 1997 and 2015 run along the side. When I published the book the weekly reading in the 3.4 Niño region was +1.7. A month later updates were made to include a weekly anomaly reading of +2.4. This posting shows +2.7 in the 3.4 Niño region. 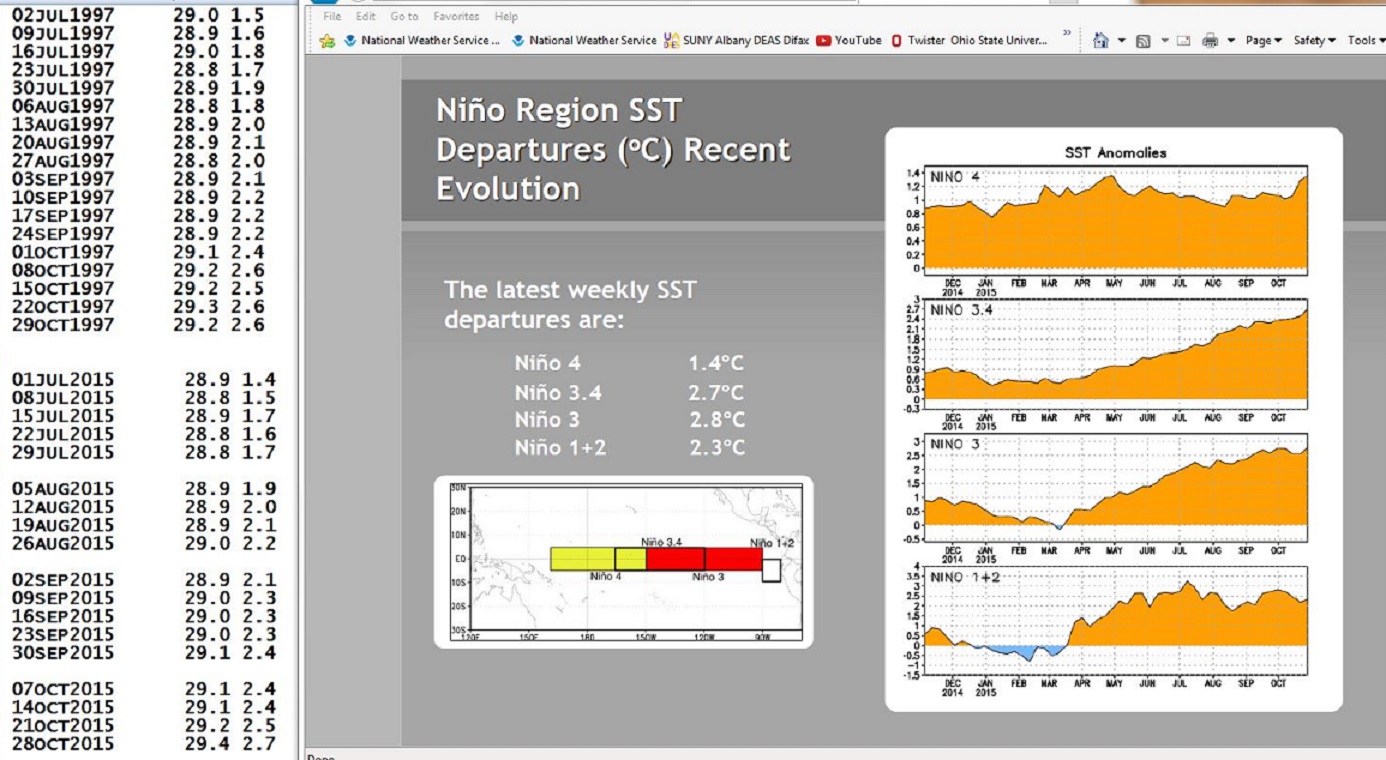
I present all this to impress you with the fact, that we are all in serious trouble. The 20 inch floods of October were not just a spell of bad weather. They are the product of a periodic oceanographic and meteorological worldwide teleconnection otherwise known as El Niño. The numbers presented above illustrate that our current 2015 event is as strong as the 1997 event and still growing.
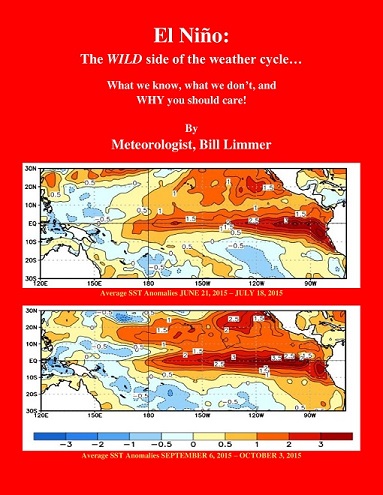
Learn more in my latest e-book El Niño: The WILD side of the weather cycle…
What we know, what we don’t, and WHY you should care!
I show how this years Pacific water temperatures compare to the 1982 and 1997 events and highlight the kind of weather episodes that these stronger El Niño’s tend to bring.
If you like the blog you will love the book.
Wild Bill