October 06, 2015 – Hurricane moves away, but still a 1000 year flood
Below are some of the highest rainfall amounts in Charleston County, South Carolina from the recent storm. These are four day amounts, Friday Oct. 2 thru Monday Oct. 5. There is no landform that can absorb 26 inches of rain in less than 4 days. That is nearly 6 months of rain in 4 days.
CHARLESTON COUNTY…
6 NE MOUNT PLEASANT 26.88 10/05 COCORAHS
3 ESE CAINHOY 25.50 10/05 STORM TOTAL
3 SSW SHADOWMOSS 24.10 10/05 NWS EMPLOYEE
5 SSE CHARLESTON 23.61 10/05 COCORAHS
3 SW FOLLY BEACH 21.45 10/05 COCORAHS
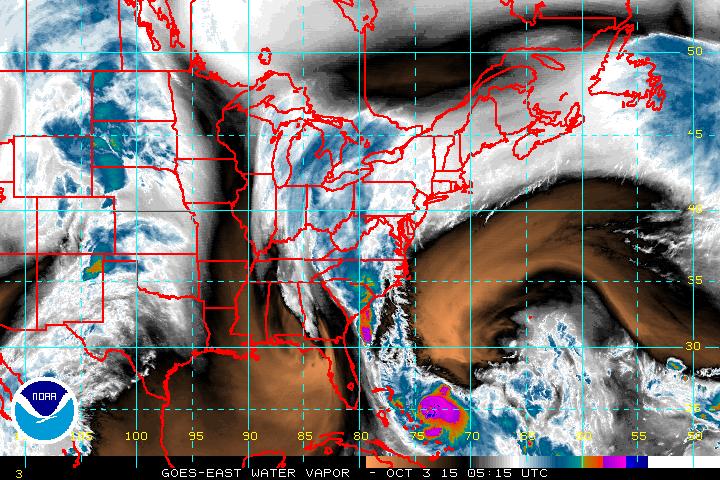
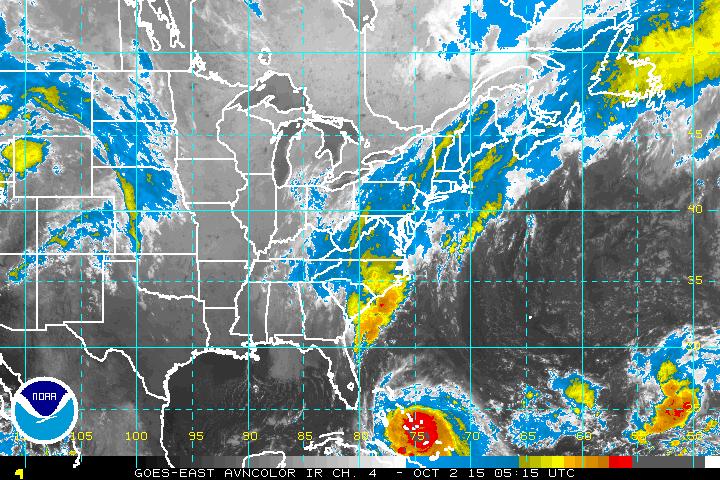
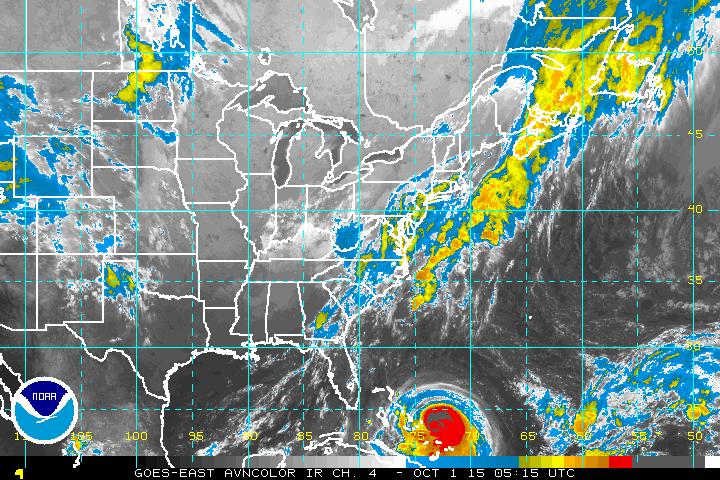
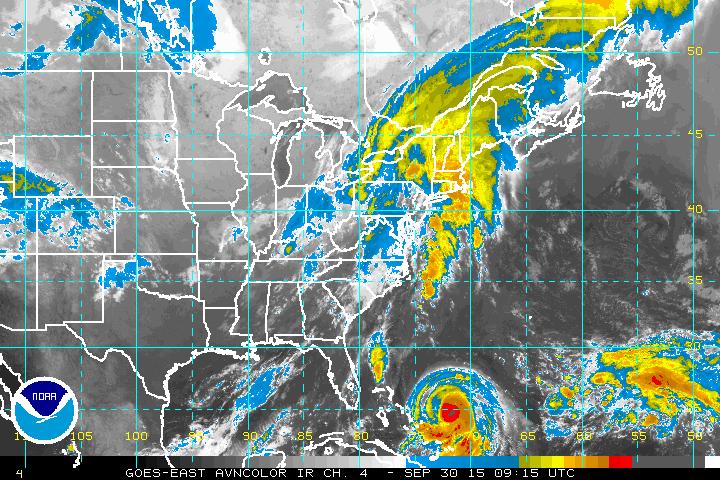
This was the last image on my last blog early Saturday showing the rain in progress across The Palmetto State .
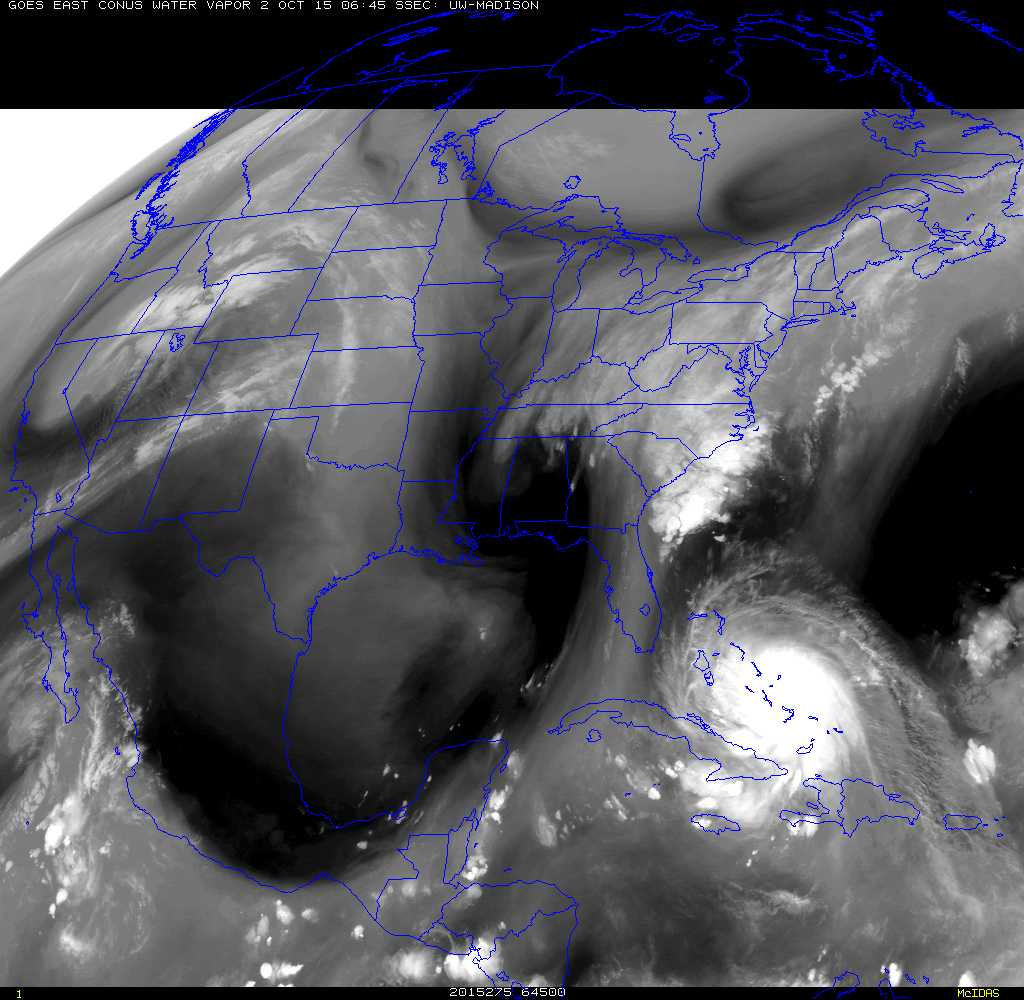
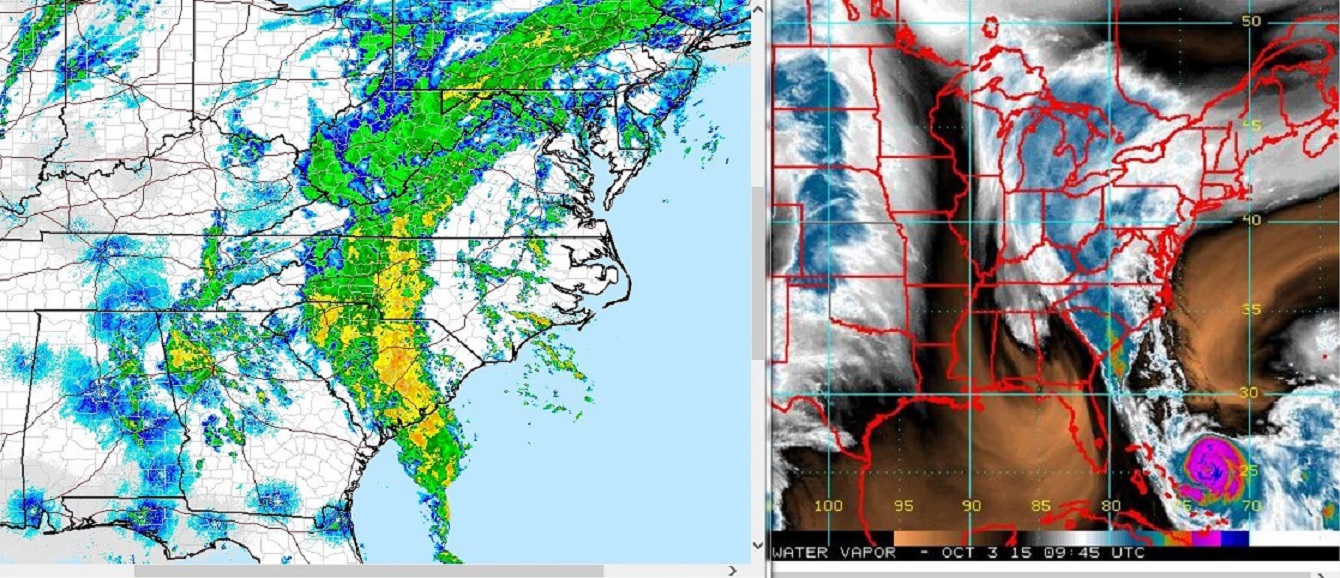
The deluge continued into Saturday across mainly South Carolina. Regional radar and water vapor imagery show the narrow channel of moisture from the hurricane to South Carolina .
With both the Perfect Storm of October 1991, and the record Maine flood of October 1996, it was dying and decaying tropical systems that kicked in the excess moisture.
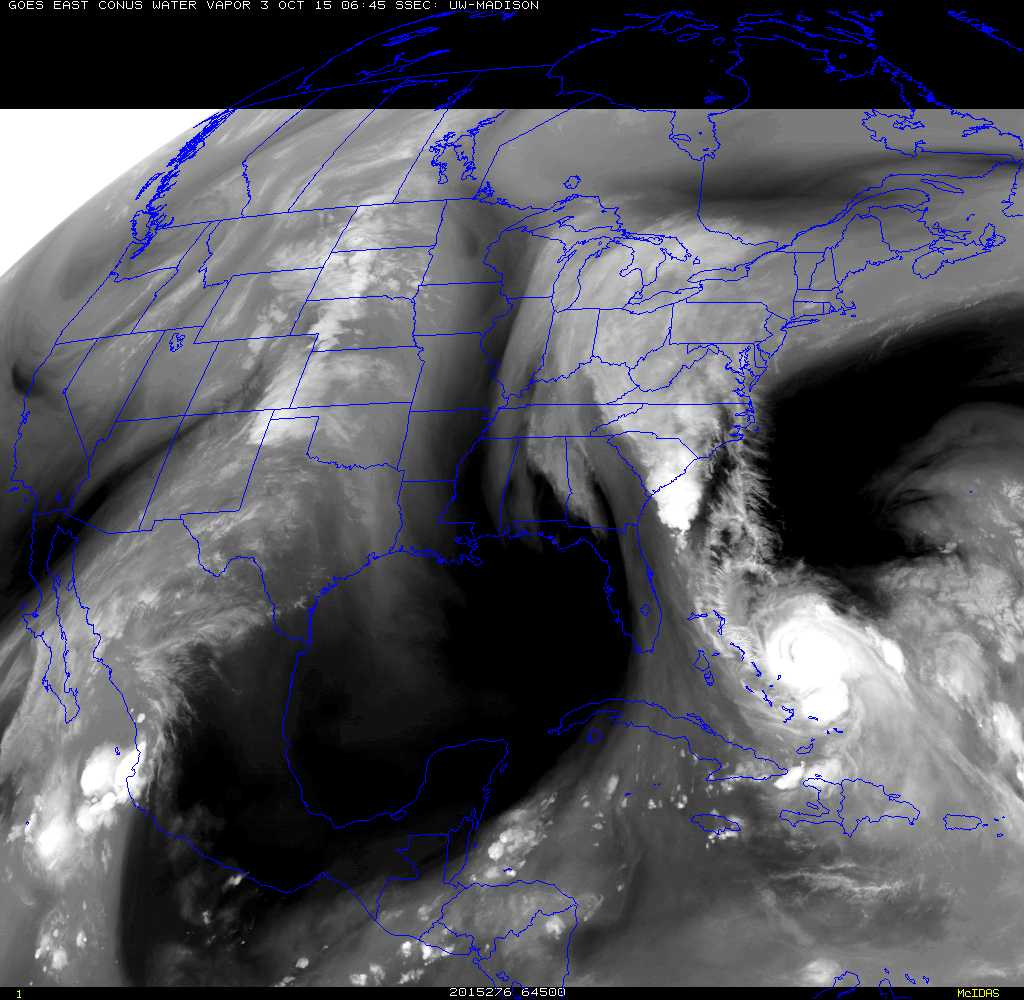
Water vapor image from midday Saturday showing a rare eye from Joaquin when the storm was near its strongest point. The image was taken around the same time Air Force reconnaissance survived a gust to 144 knots which is about 165 mph. The Hurricane Center briefly lifted top winds on the hurricane to 155 mph, just under Category 5 status.
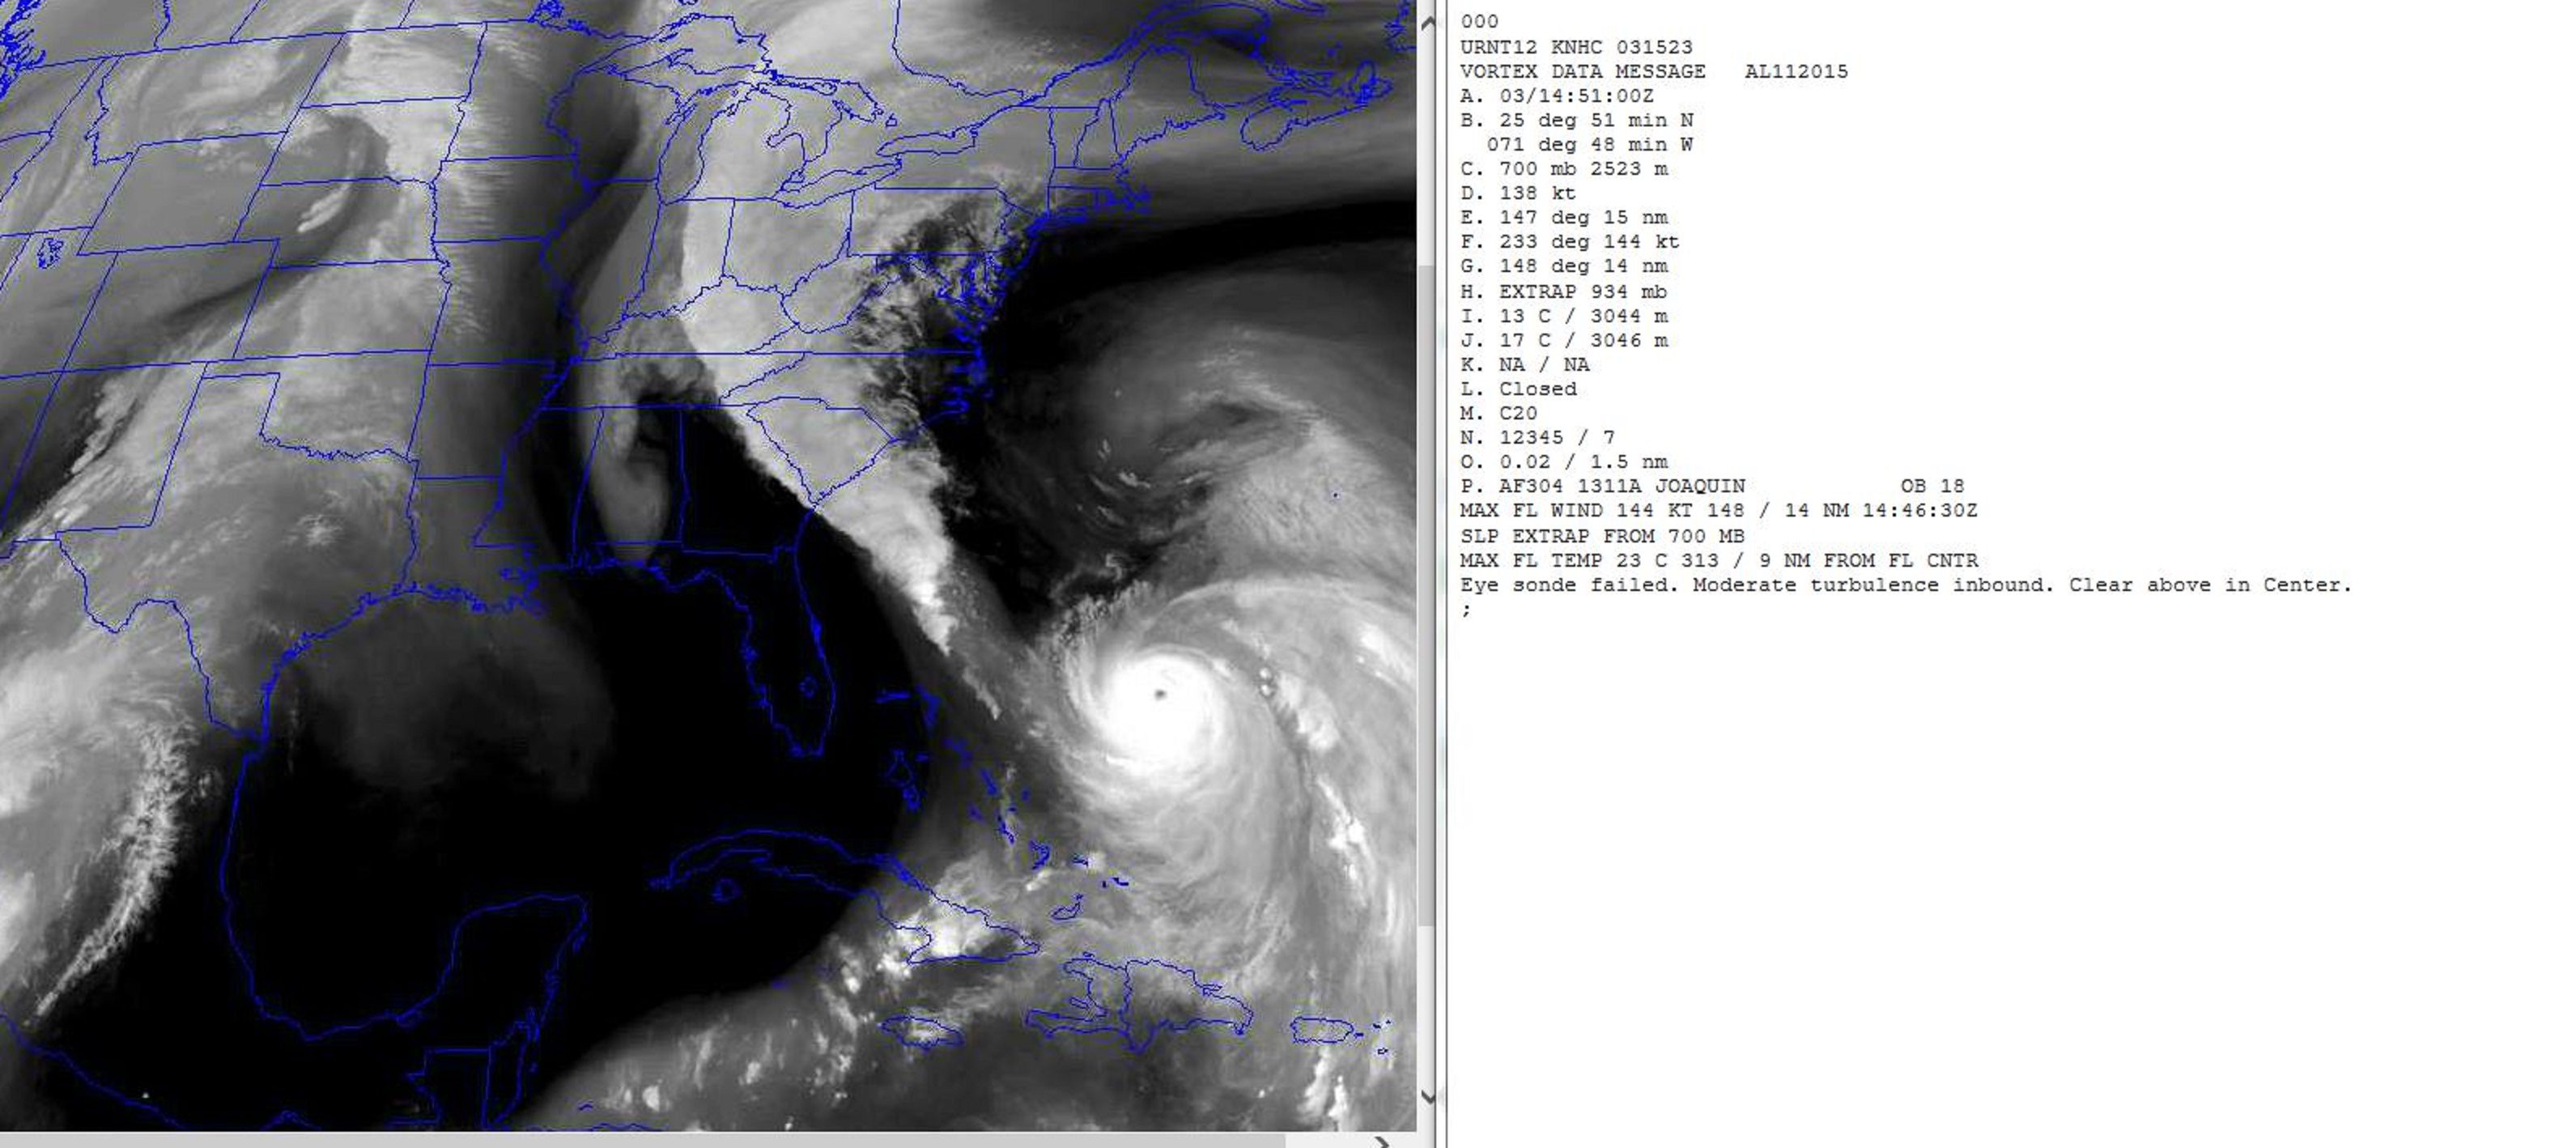
MAX FL WIND 144 KT 148 / 14 NM 14:46:30Z
Maximum Flight Level Wind 144 Knots from 148 degrees or SSE, the observation occurred 14 nautical miles from the center of Joaquin at 14:46z or 10:36 AM EST Saturday morning.
Again 144 knots is about 165 mph, all this from a VORTEX DATA MESSAGE sent by Air Force reconnaissance. The entire message below includes a description of the ride into the storm and what they found when they got there, Moderate turbulence inbound. Clear above in Center.
URNT12 KNHC 031523
VORTEX DATA MESSAGE AL112015
A. 03/14:51:00Z
B. 25 deg 51 min N
071 deg 48 min W
C. 700 mb 2523 m
D. 138 kt
E. 147 deg 15 nm
F. 233 deg 144 kt
G. 148 deg 14 nm
H. EXTRAP 934 mb
I. 13 C / 3044 m
J. 17 C / 3046 m
K. NA / NA
L. Closed
M. C20
N. 12345 / 7
O. 0.02 / 1.5 nm
P. AF304 1311A JOAQUIN OB 18
MAX FL WIND 144 KT 148 / 14 NM 14:46:30Z
SLP EXTRAP FROM 700 MB
MAX FL TEMP 23 C 313 / 9 NM FROM FL CNTR
Eye sonde failed. Moderate turbulence inbound. Clear above in Center.
The rain Friday into Saturday was already creating a disaster, but the rain continued, and it continued across the same South Carolina counties thru Saturday, Saturday night and into Sunday. Hurricane Joaquin traveled hundreds of miles and the moisture channel just pivoted with the storm never losing its connection to South Carolina.
Saturday morning Sunday morning
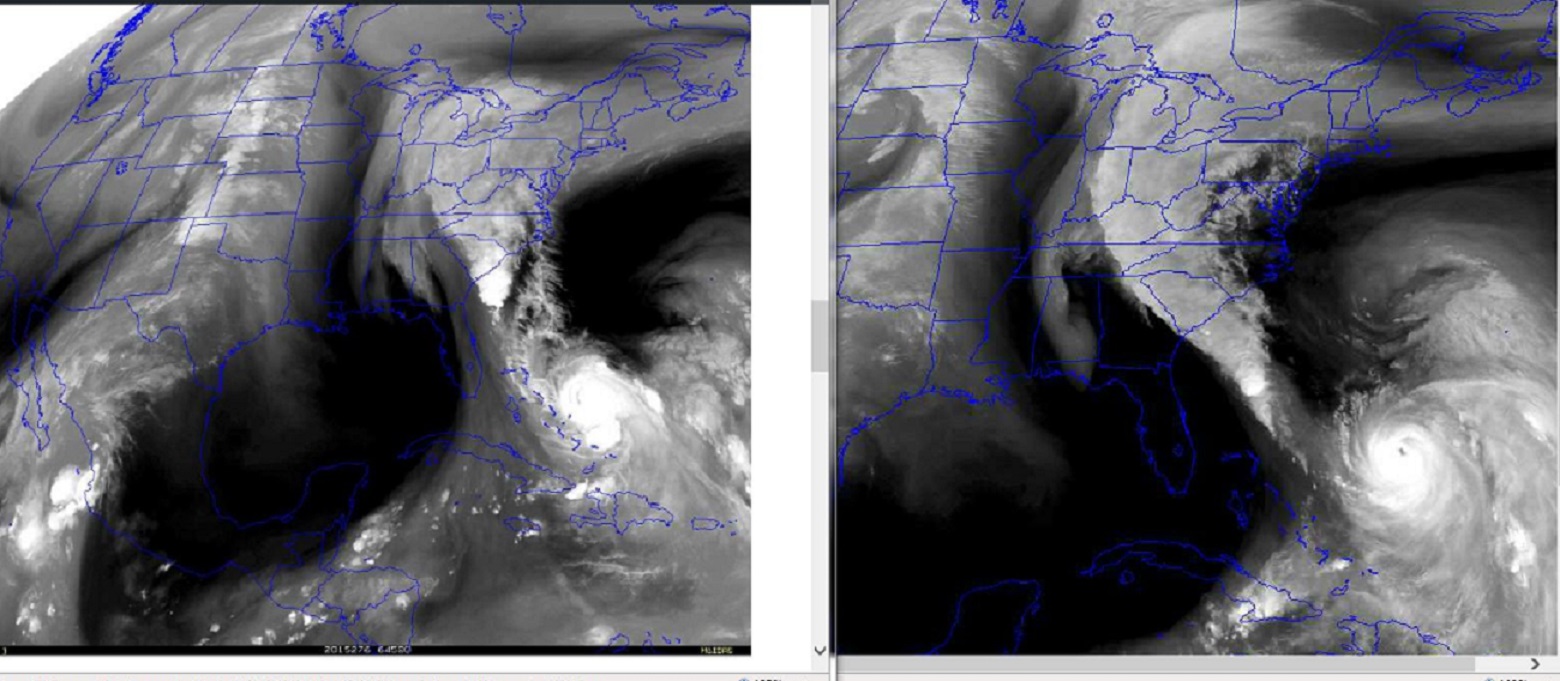
The hurricane actually did just move away. This is quite miraculous considering what some of the model forecasts were doing with a possible landfall.
So, a unique event to be sure, we were fortunate the hurricane itself stayed far from the United States. South Carolina did NOT get another Hugo. But still got nailed with what is being called a “1000 year” event. An event of this magnitude is expected once every 1000 years.
El Niño is still alive and well in early October, the most recent weekly region 3.4 anomalies are running dead even with 1997. So, this El Niño thing is happening, we gotta be on guard. The Joaquin situation evolved very quickly. It really could have been any where along the coast. So, who’s going to be next? When is the next 1000 year flood?
01OCT1997 29.1C 2.4C
30SEP2015 29.1C 2.4C
More on these warm anomalies later this week.
Welcome to El Niño.
Learn more in my latest e-book El Niño: The WILD side of the weather cycle…What we know, What we don’t, and Why you should care!
Wild Bill