December 18, 2015
It looks like warm weather across the parts of the East in the days before Christmas for the third year in a row.
Maximum temperatures December 22, 2013, … 60’s to low 70s across Mid-Atlantic States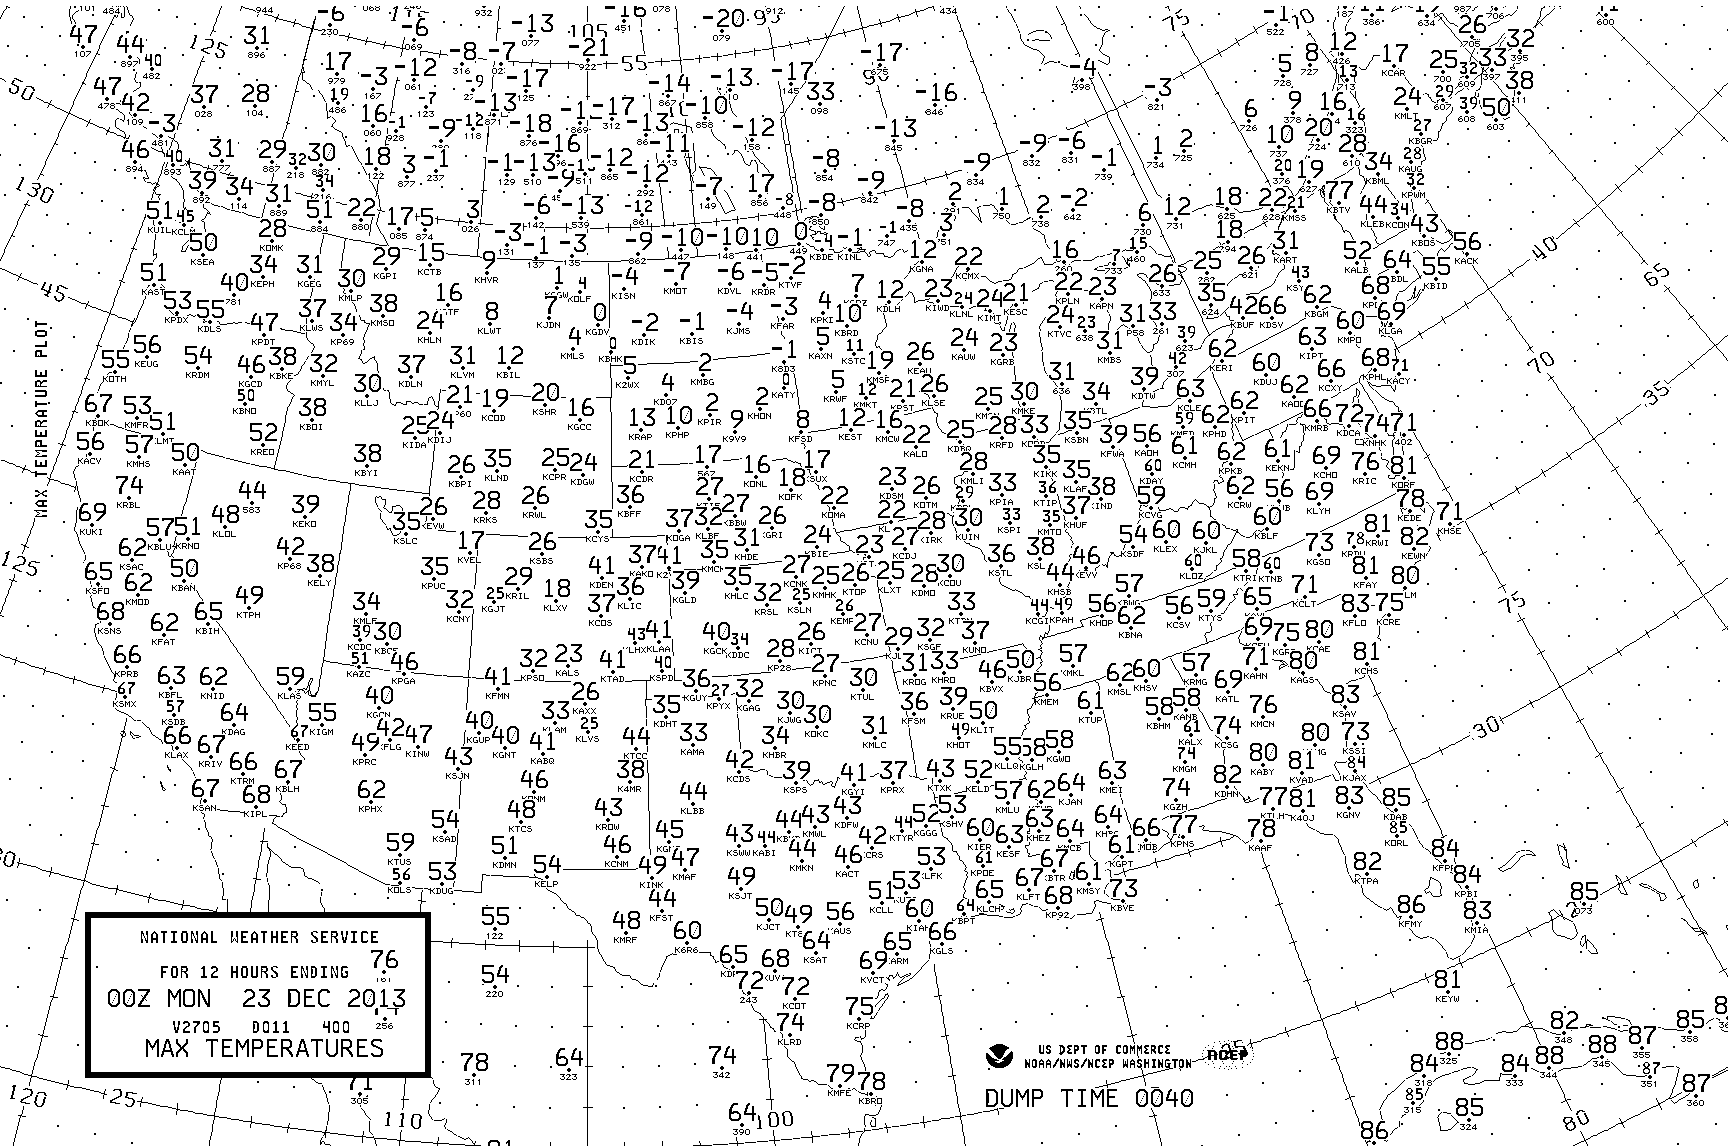
Maximum temperatures December 24, 2014, … not as warm as 2013, but well above freezing. 60 at Pittsburgh however, is only 2 cooler than its 2013 reading.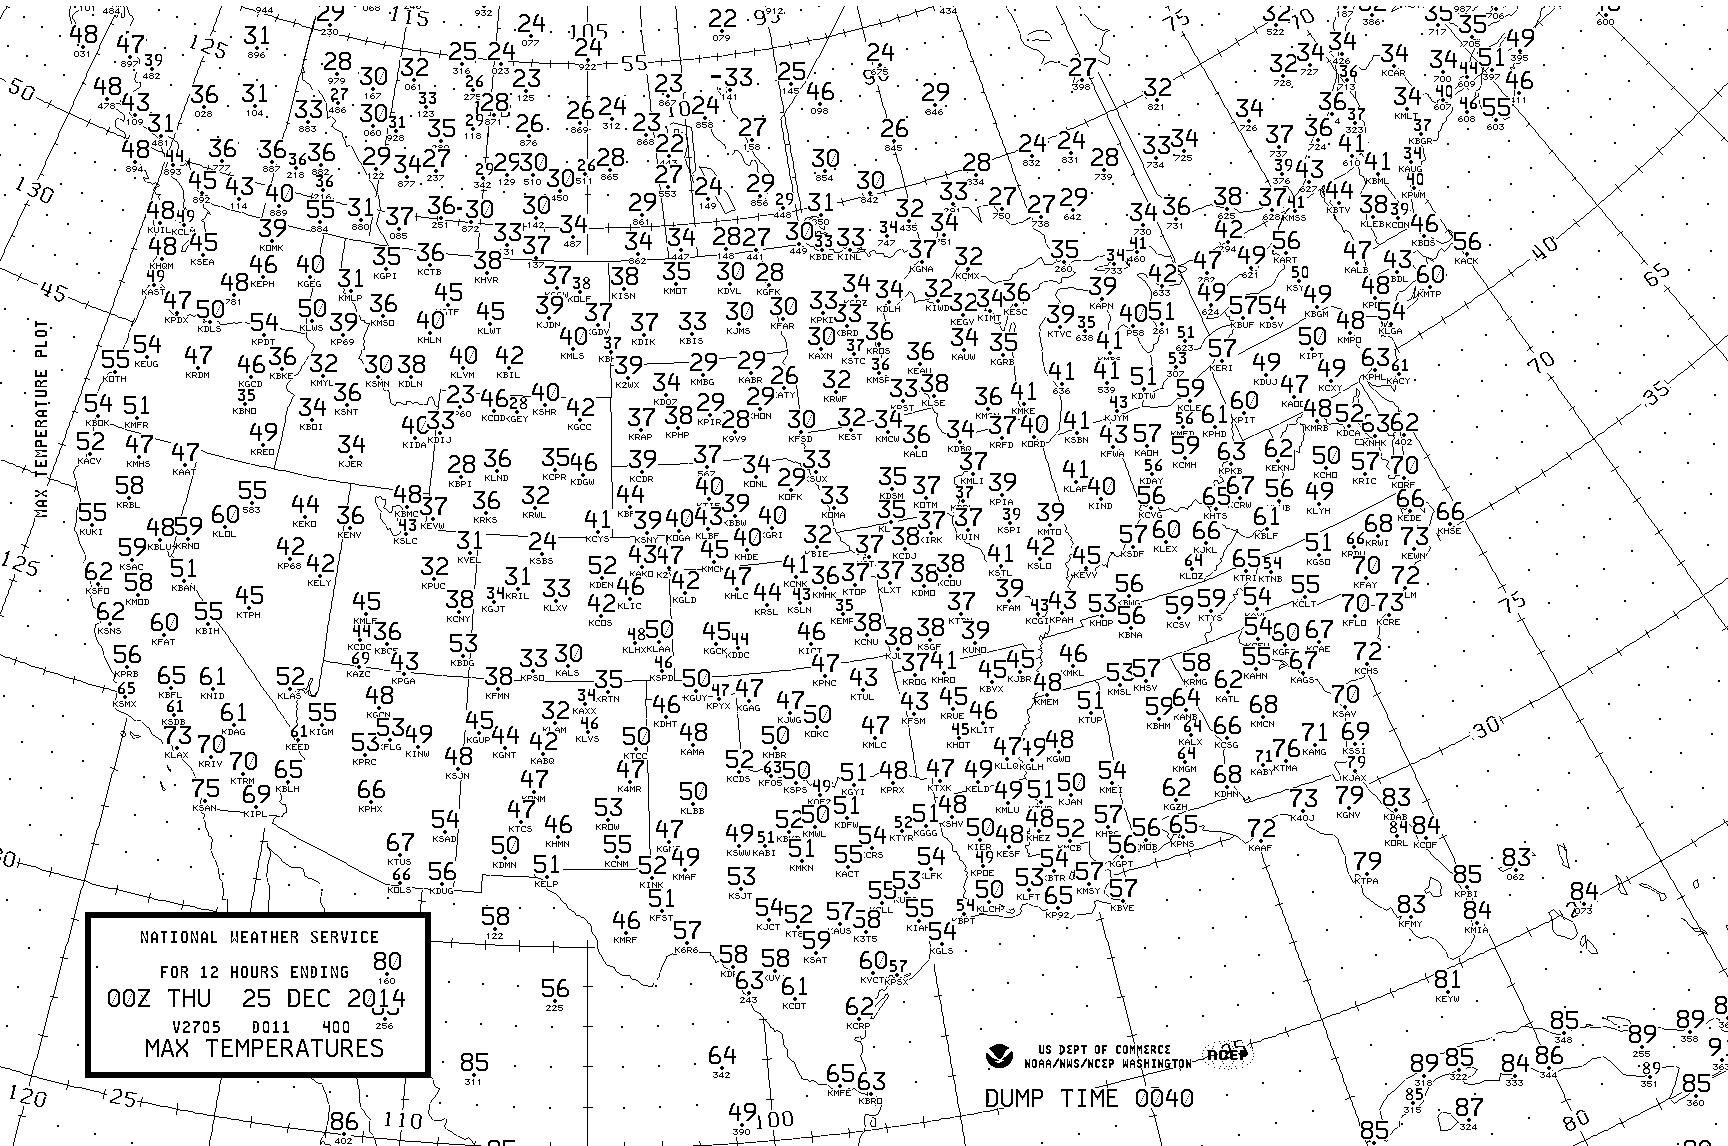
Forecast for this December 23, 2015 also looks quite warm. The forecast for Pittsburgh is for a daytime high near 60. This will make three years in a row Pittsburgh will have been near 60 degrees in the days before Christmas. Normal high for December 23 for Pittsburgh is 37, making a high of 60, 23 degrees above normal.
Well below normal temperatures were experienced in Pittsburgh on December 22, 1989 when the high was only 7 above, and December 25, 1983 the high for Pittsburgh was zero.
So do not move to Pittsburgh and expect 60 degree pre-Christmas weather every year, but right now it certainly is in the forecast again this year, for the third year in a row.
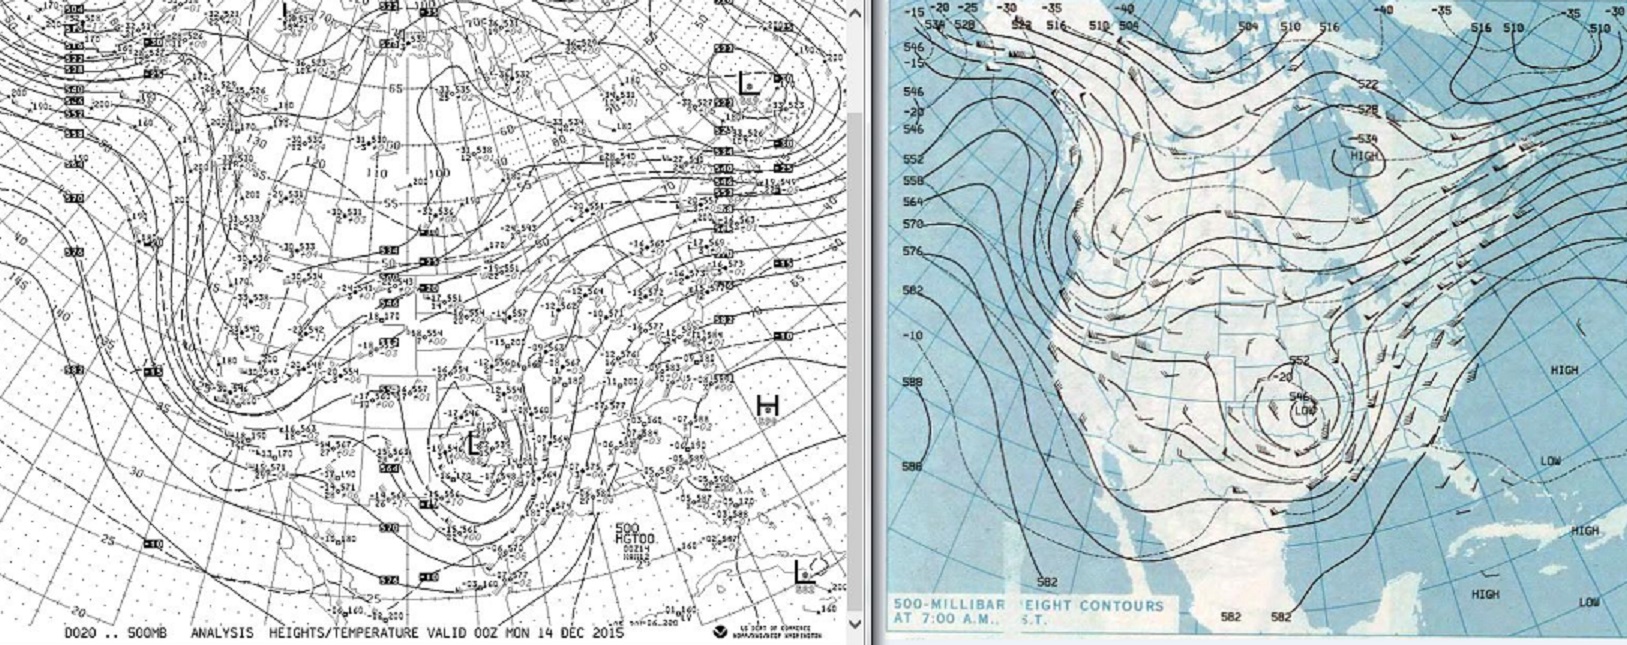
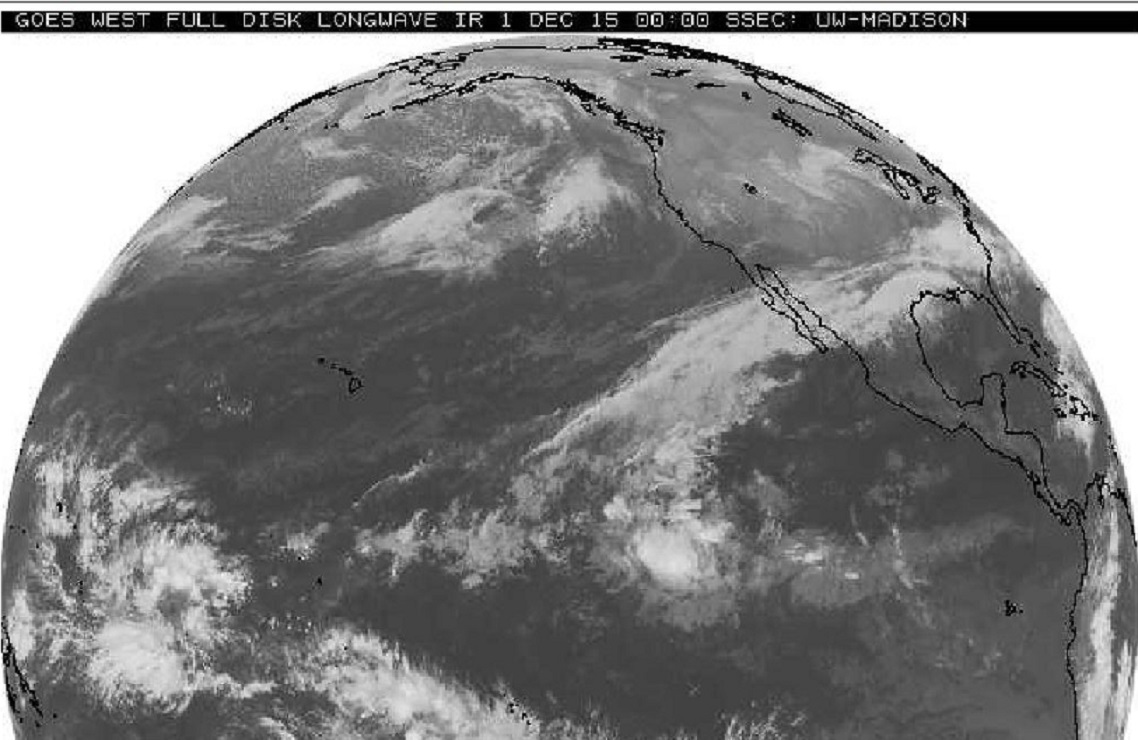
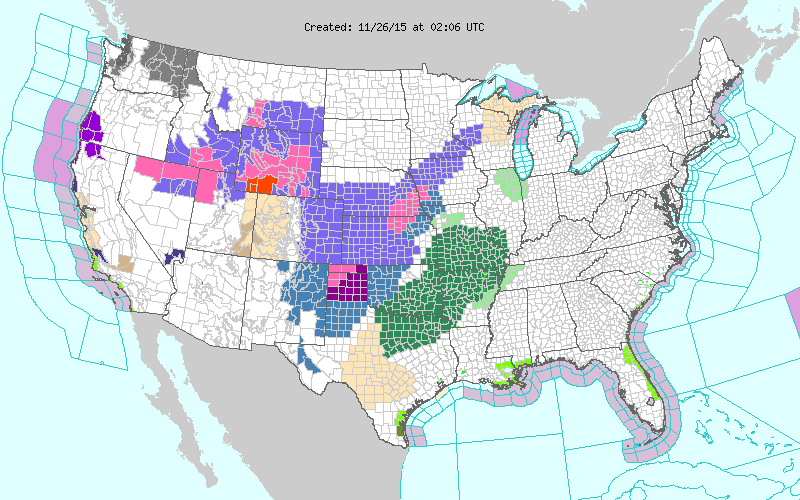
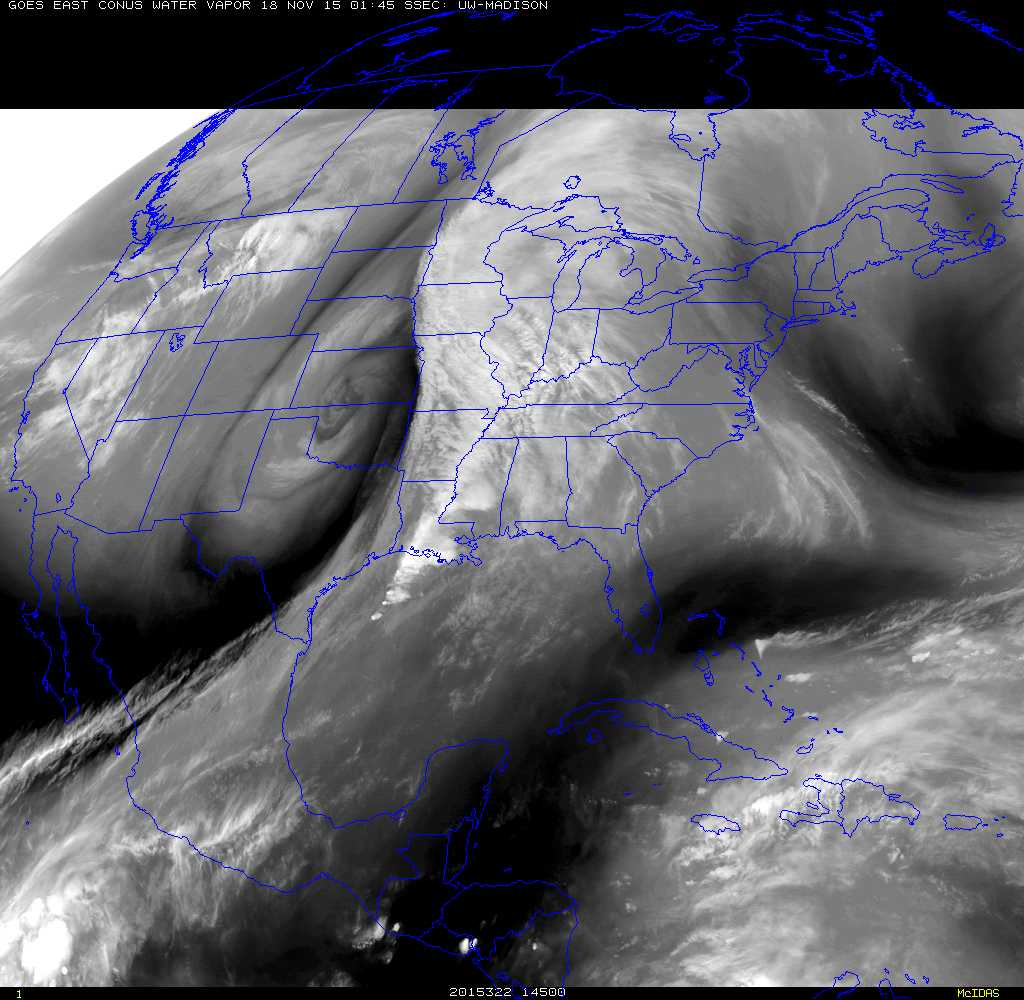
Red lines in the image above relate to above freezing temperatures. Note no blue line anywhere near Pennsylvania on this Dec. 23. How are today’s kids suppose to relate to “A Charles Brown Christmas” when there is no ice on the ponds and no snow on the ground for the third year in a row.
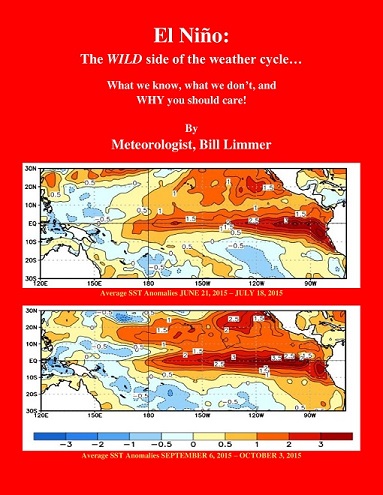
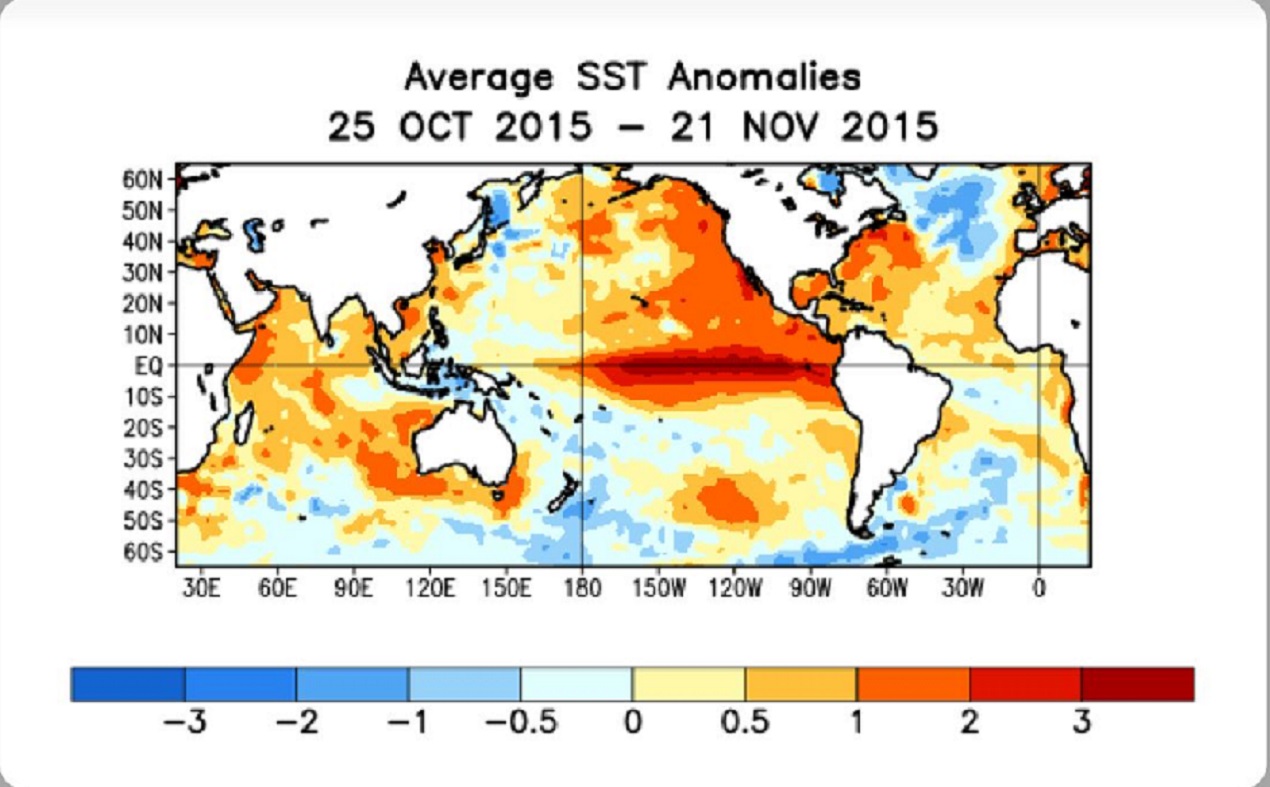
Learn more in my latest e-book El Niño: The WILD side of the weather cycle…
What we know, what we don’t, and WHY you should care!
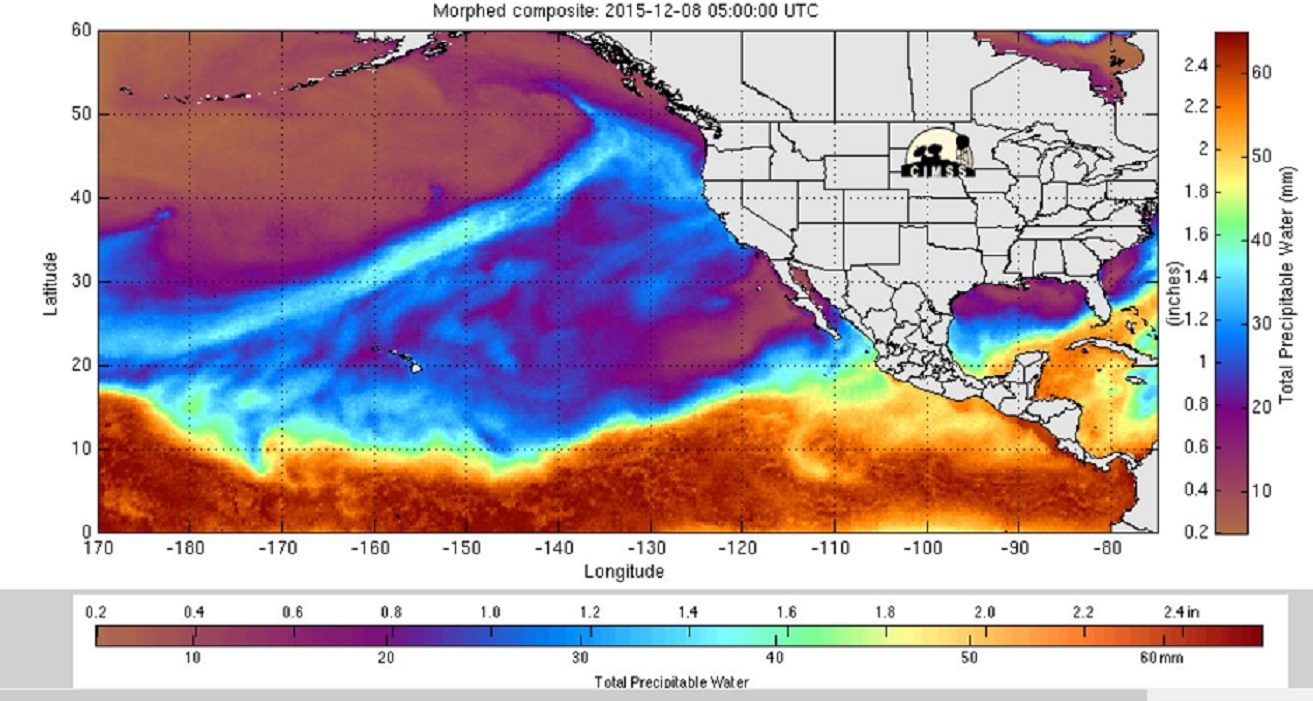
I show how this years Pacific water temperatures compare to the 1982 and 1997 events and highlight the kind of weather episodes that these stronger El Niño’s tend to bring.
If you like the blog you will love the book.

Wild Bill.