November 17, 2015
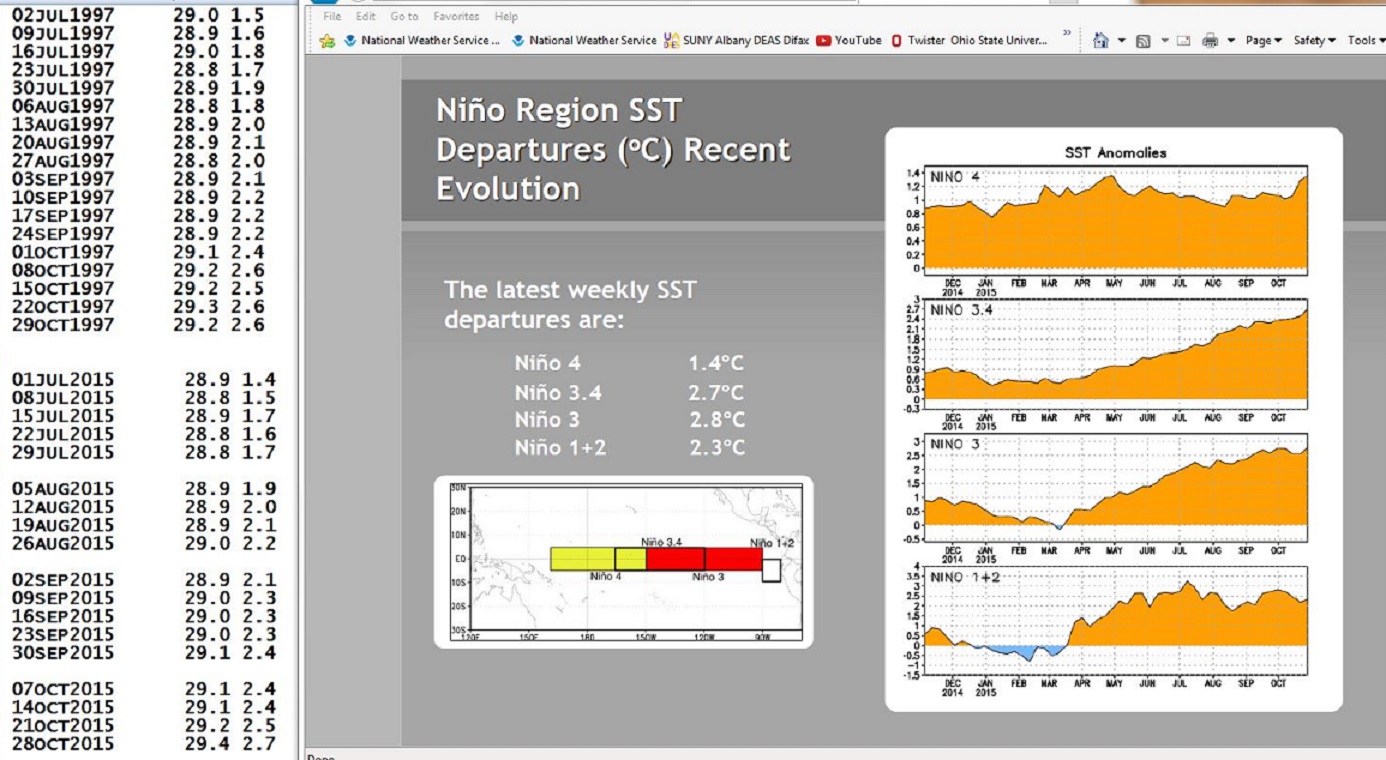
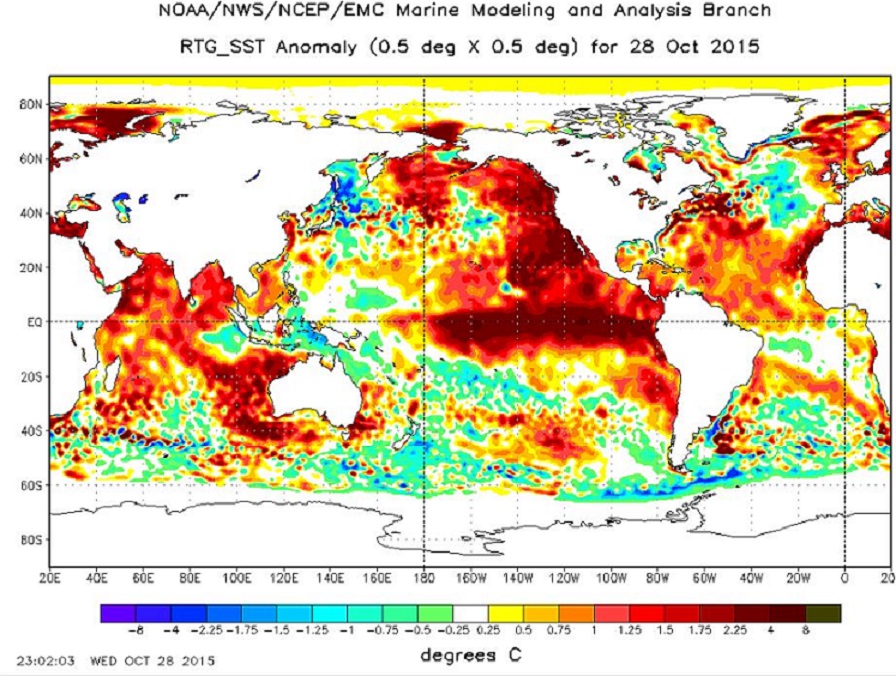
The most recent weekly sea surface temperature anomalies continue to climb in the 3.4 Niño region of the Pacific. After trailing for several weeks earlier this season, this year’s sea surface temperatures have surged ahead of the record pace of 1997 El Niño .
11NOV2015 29.7 +3.0 12NOV1997 29.3 +2.7
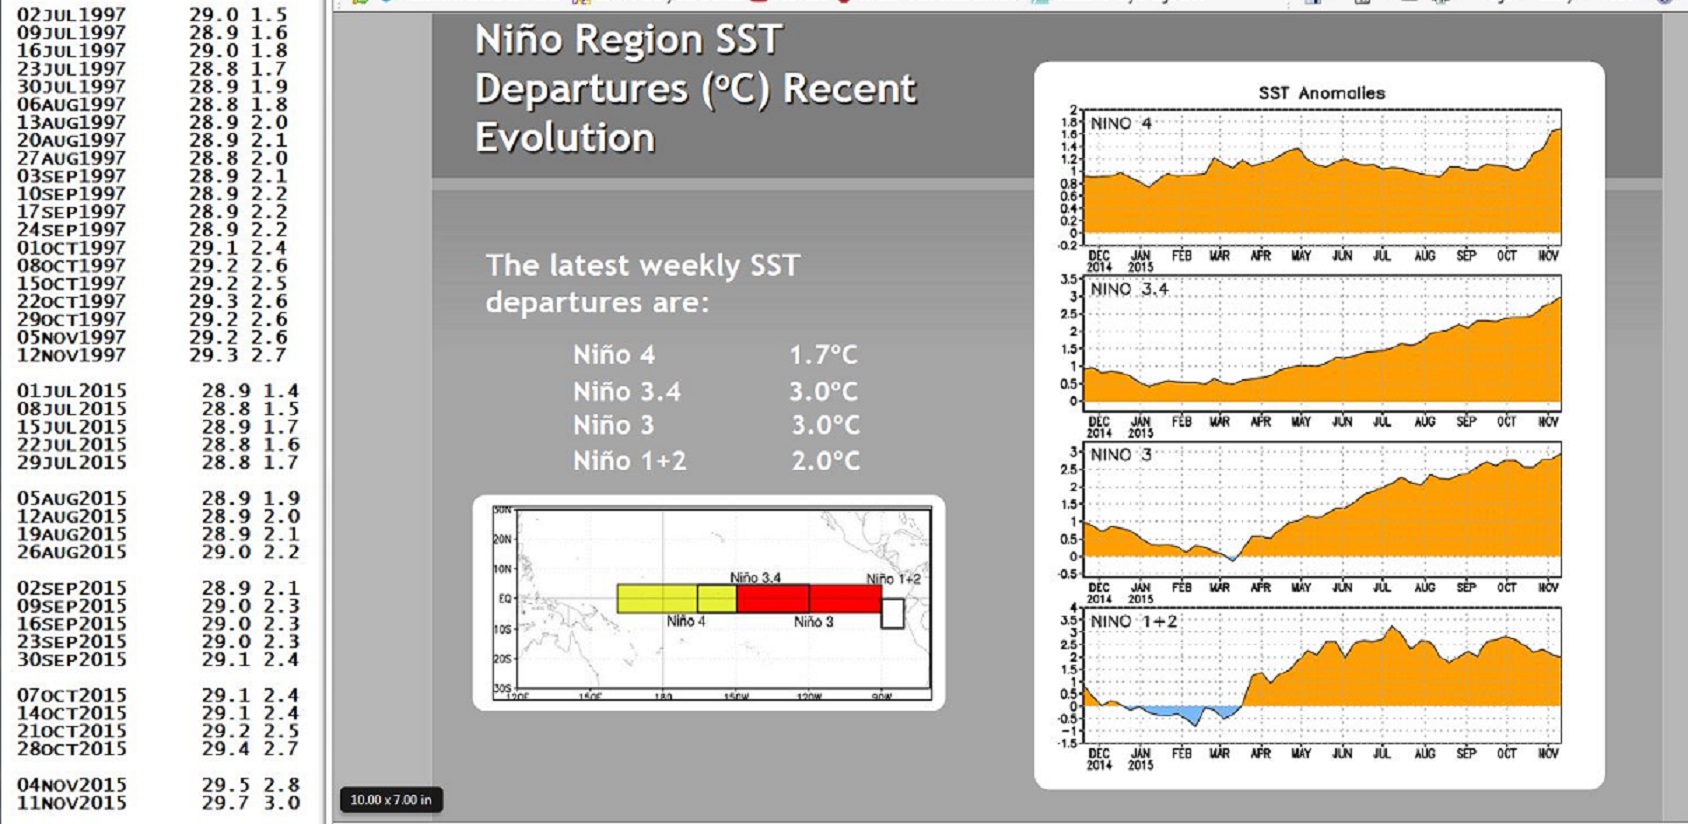
One more time, … current weekly readings show this year is ahead of the record season. The current weekly numbers exceed the two strong El Niño years of 1982 and 1997.
We are truly witnessing history, … and much more history is soon to be written. Again a side by side comparison, 2015 and the record 1997, the last four weeks of sea surface temperature anomalies.
21OCT2015 29.2 +2.5 22OCT1997 29.3 +2.6
28OCT2015 29.4 +2.7 29OCT1997 29.2 +2.6
04NOV2015 29.5 +2.8 05NOV1997 29.2 +2.6
11NOV2015 29.7 +3.0 12NOV1997 29.3 +2.7
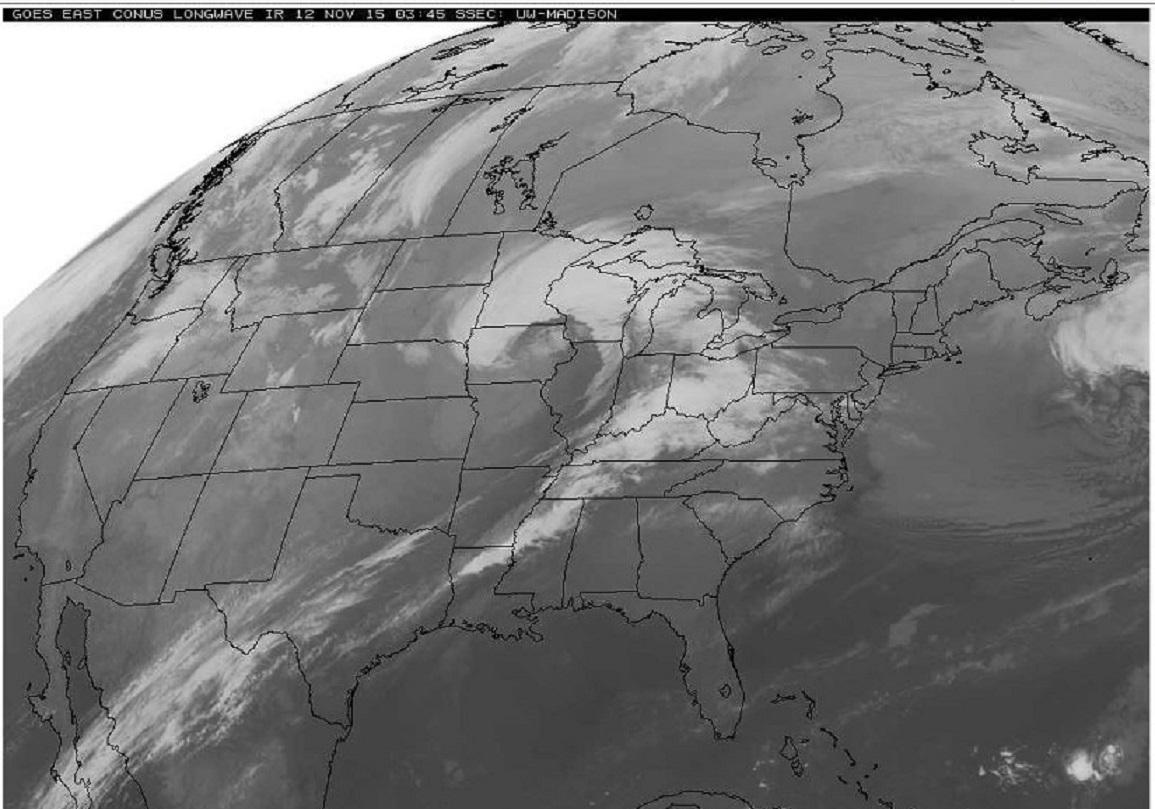
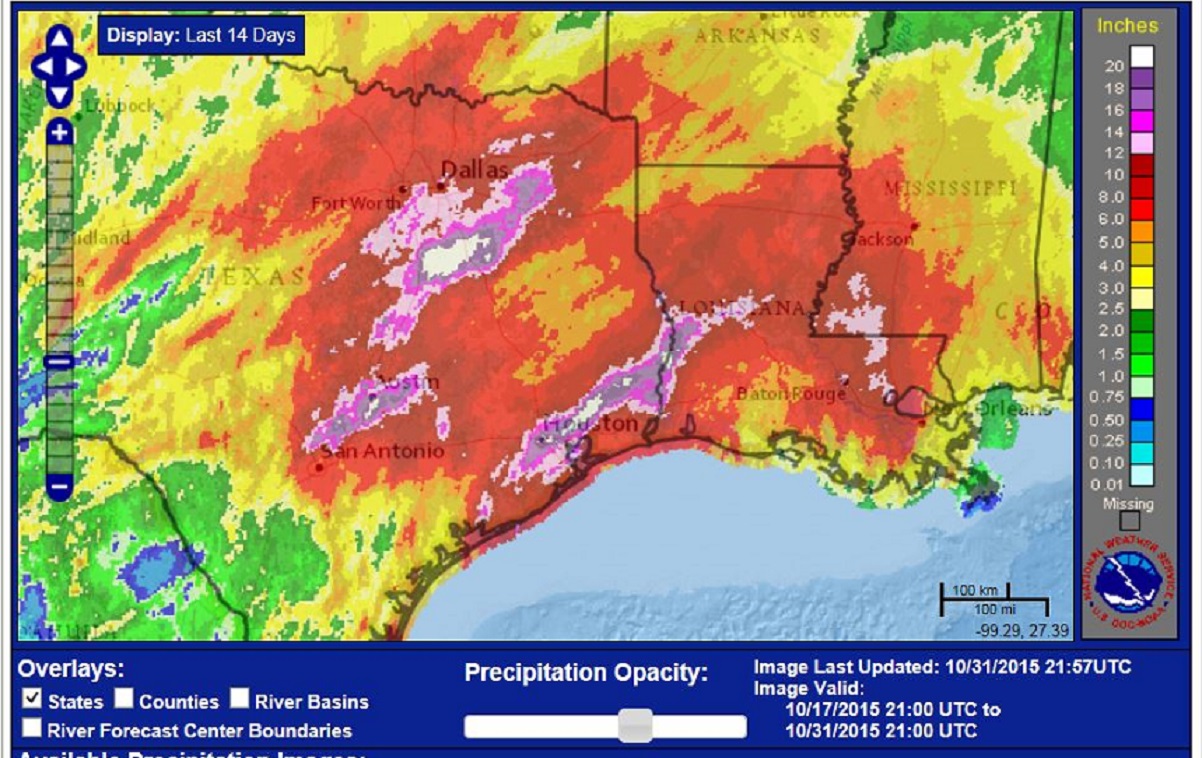
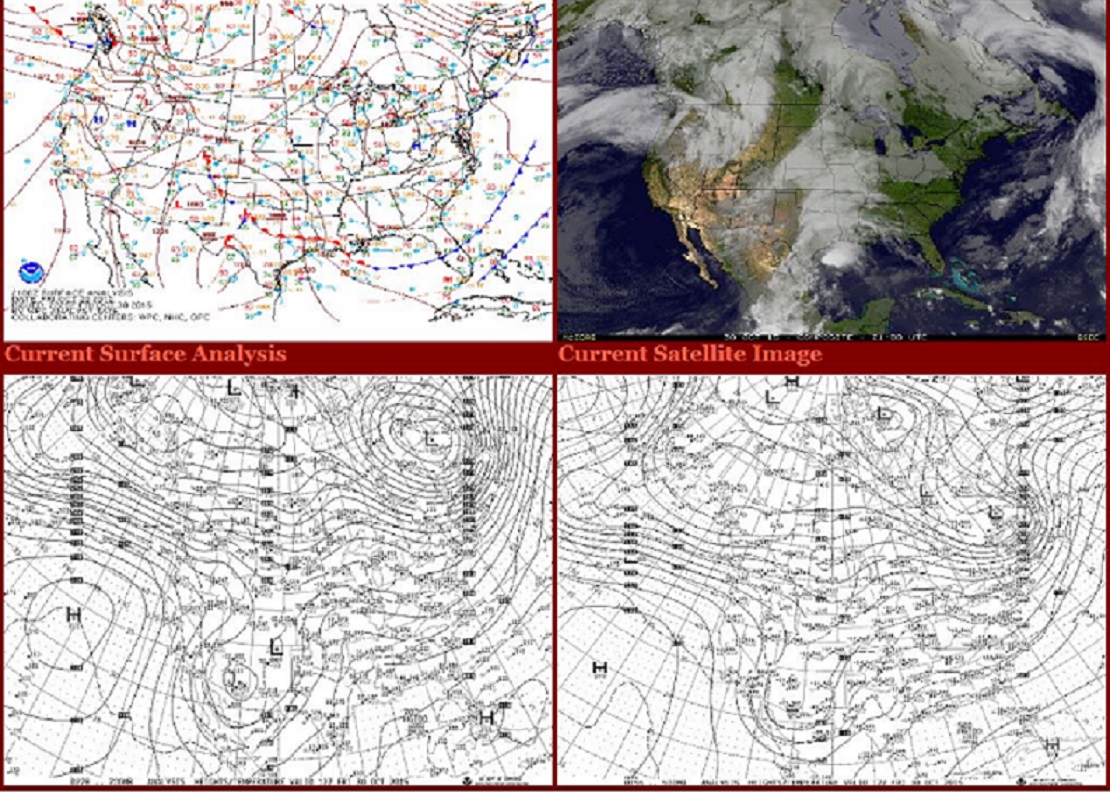
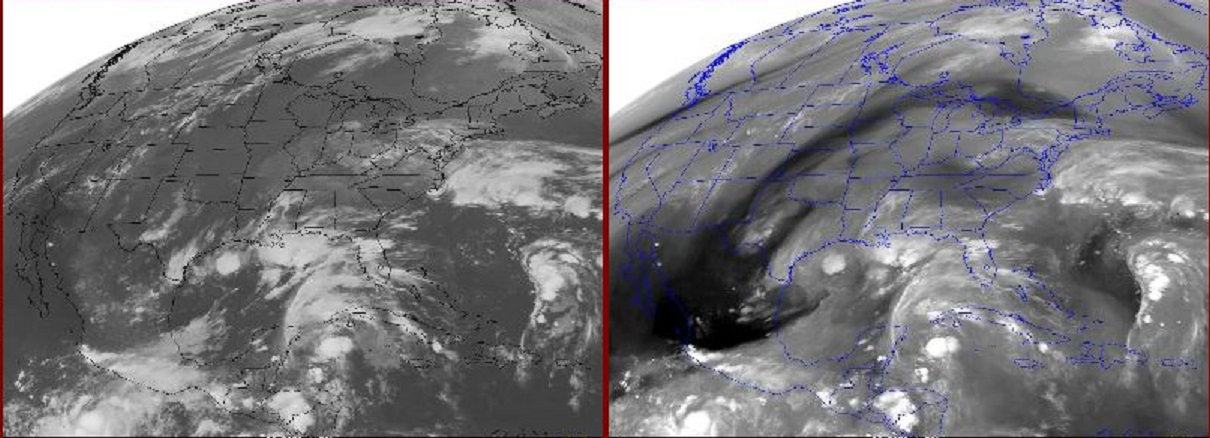
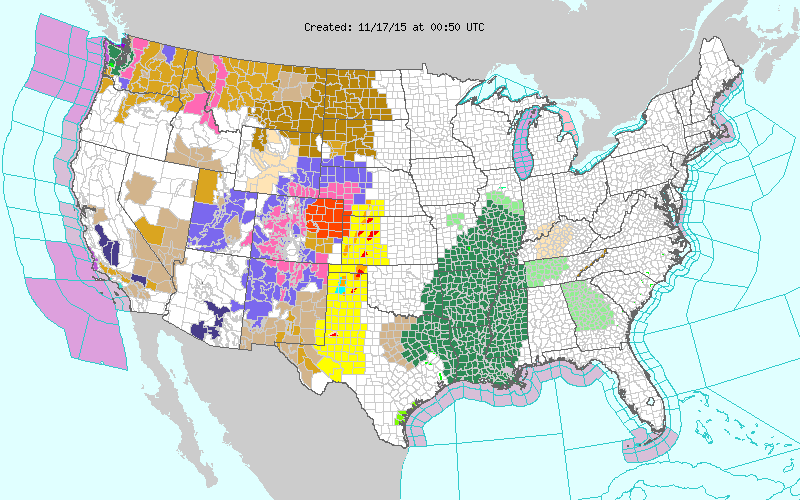
The NWS Warnings page on Monday evening nicely illustrates the current storm. Winter Storm and Blizzard Warnings sitting right next to Tornado Watches and Warnings. This snapshot catches 6 Tornado Warnings in effect at the same time. That is a little unusual and scary, this activity is occurring after dark in mid November.
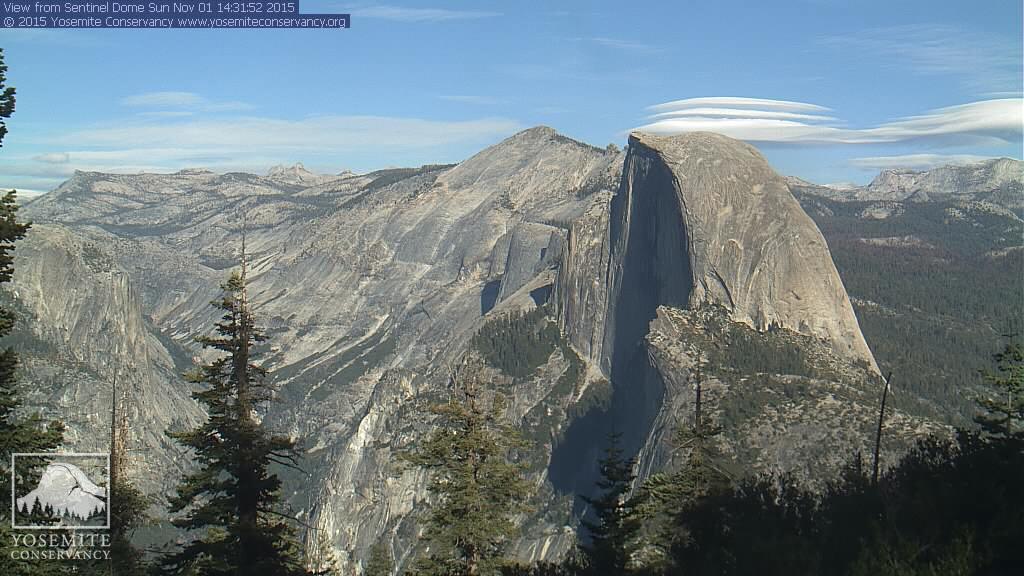
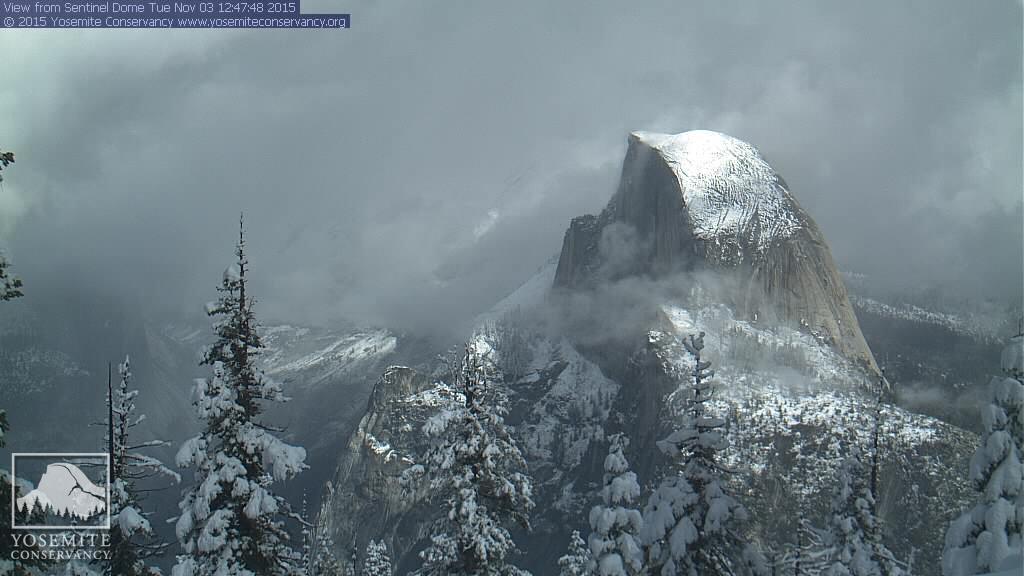
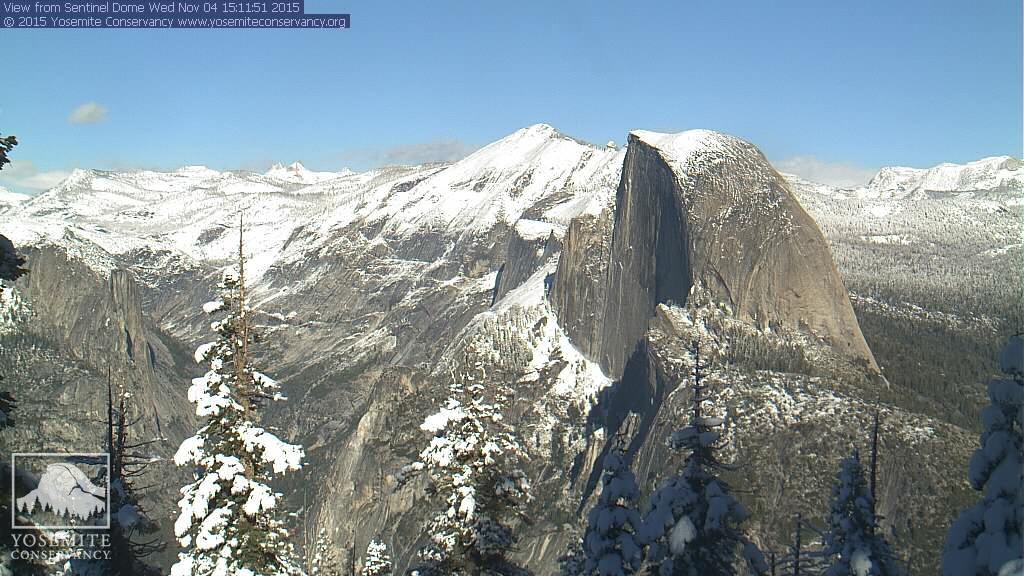
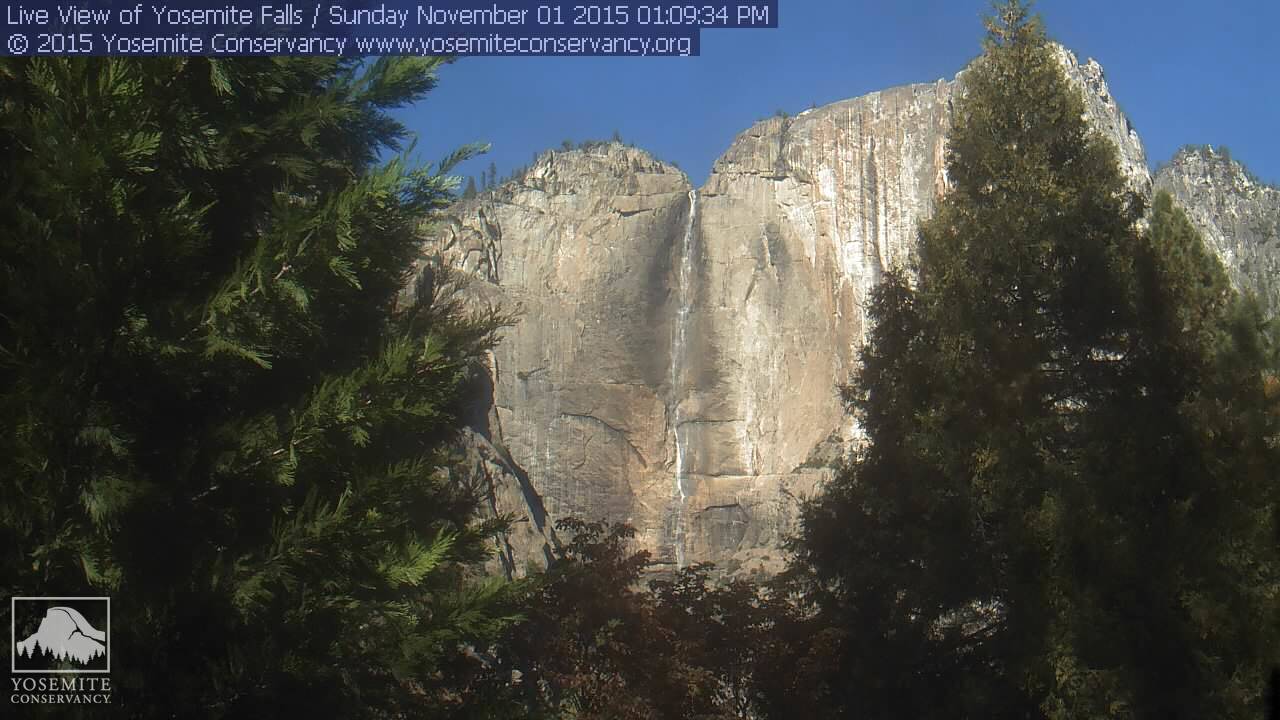
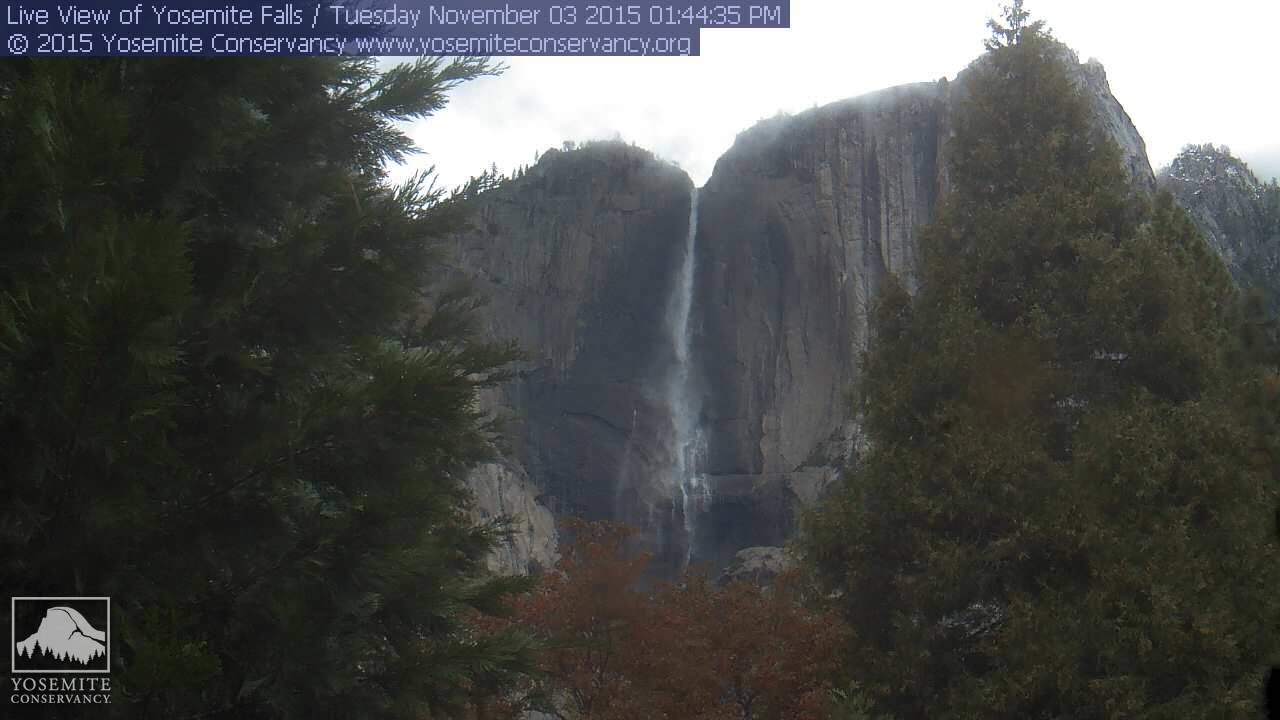
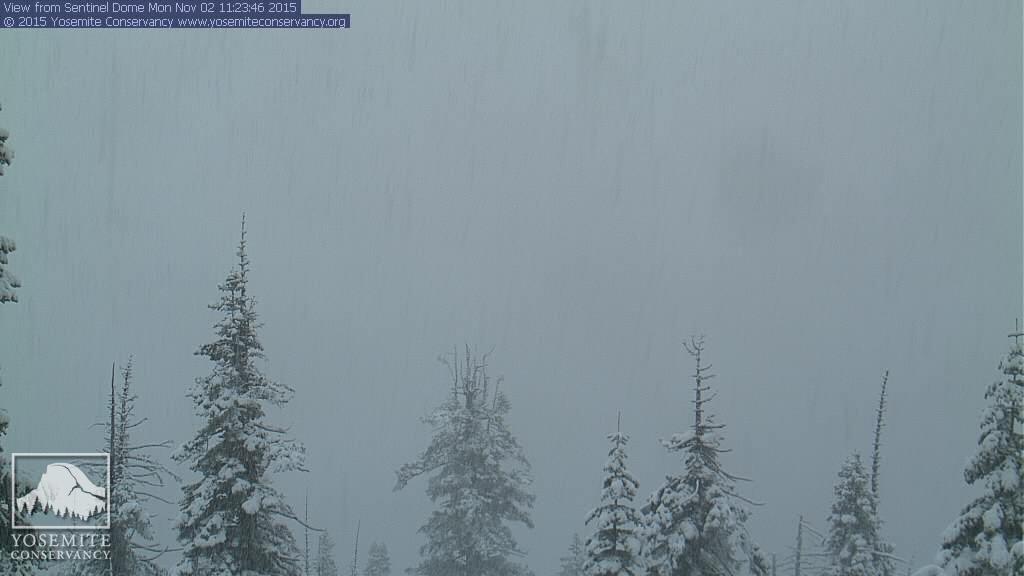
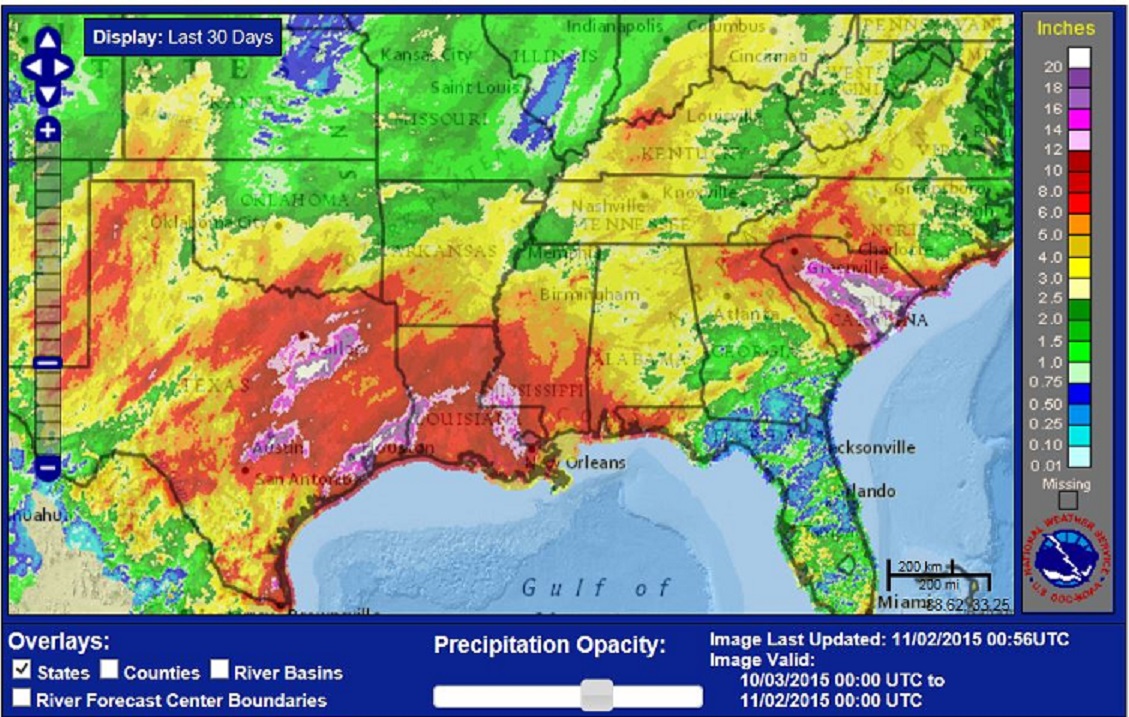
A little taste of what the storm left behind in California.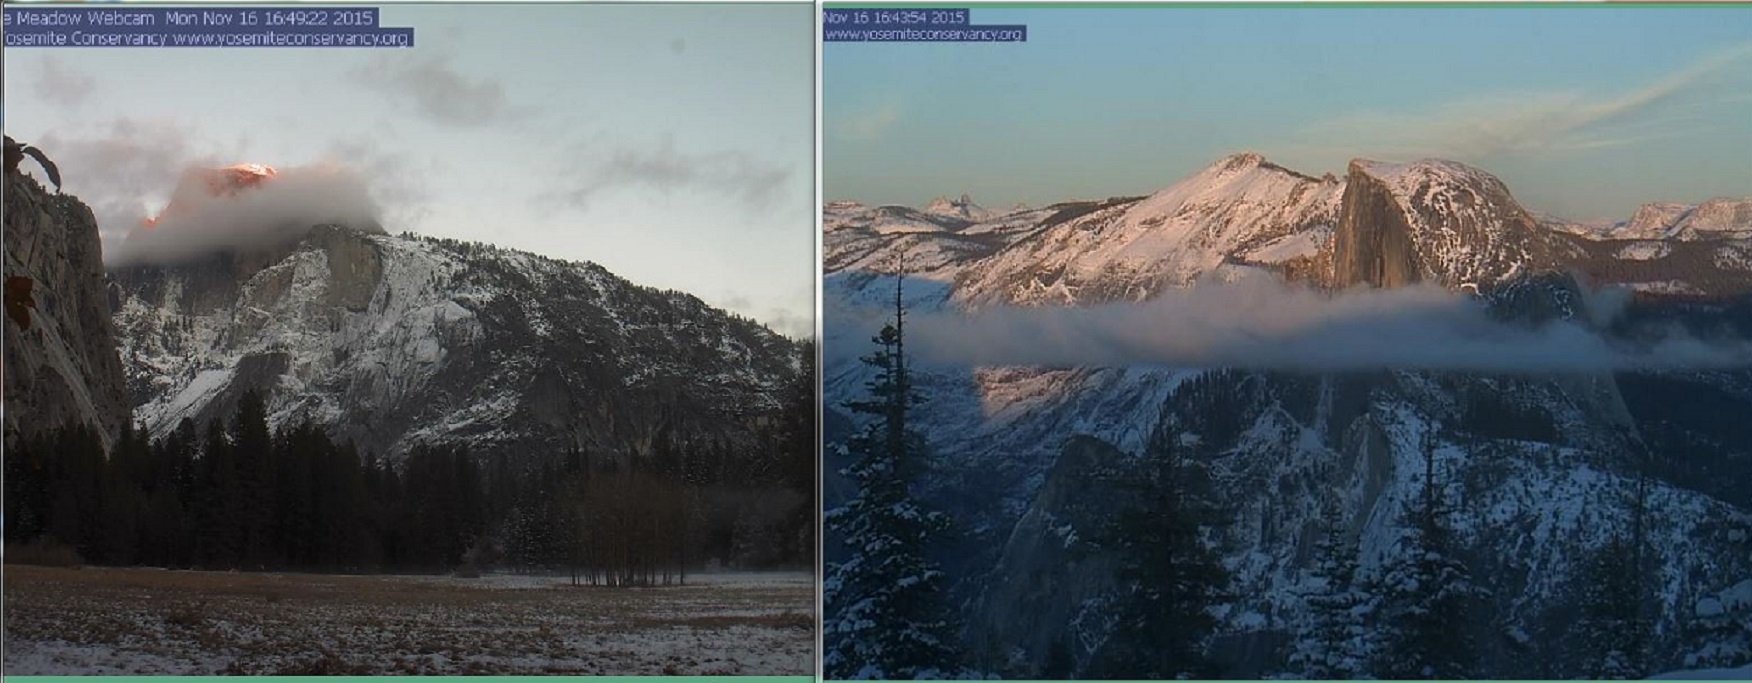
Learn more in my latest e-book El Niño: The WILD side of the weather cycle…
What we know, what we don’t, and WHY you should care!
I show how this years Pacific water temperatures compare to the 1982 and 1997 events and highlight the kind of weather episodes that these stronger El Niño’s tend to bring.
If you like the blog you will love the book.
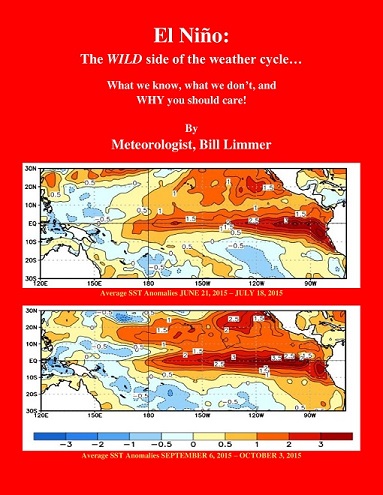
Wild Bill